Polling Analysis and Election Forecasting

Author: Drew (Page 4 of 7)

Drew Linzer is a statistician and survey scientist based in Oakland, CA. He was previously an Assistant Professor of Political Science at Emory University. Drew holds a PhD in Political Science from the University of California, Los Angeles.

Into the Home Stretch

With the debates complete, and just two weeks left in the campaign, there’s enough state-level polling to know pretty clearly where the candidates currently stand. If the polls are right, Obama is solidly ahead in 18 states (and DC), totaling 237 electoral votes. Romney is ahead in 23 states, worth 191 electoral votes. Among the remaining battleground states, Romney leads in North Carolina (15 EV); Obama leads in Iowa, Nevada, New Hampshire, Ohio, and Wisconsin (44 EV); and Florida, Virginia, and Colorado (51 EV) are essentially tied. Even if Romney takes all of these tossups, Obama would still win the election, 281-257.

The reality in the states – regardless of how close the national polls may make the election seem – is that Obama is in the lead. At the Huffington Post, Simon Jackman notes “Obama’s Electoral College count lies almost entirely to the right of 270.” Sam Wang of the Princeton Election Consortium recently put the election odds “at about nine to one for Obama.” The DeSart and Holbrook election forecast, which also looks at the current polls, places Obama’s re-election probability at over 85%. Romney would need to move opinion by another 1%-2% to win – but voter preferences have been very stable for the past two weeks. And if 1%-2% doesn’t seem like much, consider that Romney’s huge surge following the first debate was 2%, at most.

From this perspective, it’s a bit odd to see commentary out there suggesting that Romney should be favored, or that quantitative, poll-based analyses showing Obama ahead are somehow flawed, or biased, or not to be believed. It’s especially amusing to see the target of this criticism be the New York Times’ Nate Silver, whose FiveThirtyEight blog has been, if anything, unusually generous to Romney’s chances all along. Right now, his model gives Romney as much as a 30% probability of winning, even if the election were held today. Nevertheless, The Daily Caller, Commentary Magazine, and especially the National Review Online have all run articles lately accusing Silver of being in the tank for the president. Of all the possible objections to Silver’s modeling approach, this certainly isn’t one that comes to my mind. I can only hope those guys don’t stumble across my little corner of the Internet.

Model Checking

One of the fun things about election forecasting from a scientific standpoint is that on November 6, the right answer will be revealed, and we can compare the predictions of our models to the actual result. It’s not realistic to expect any model to get exactly the right answer – the world is just too noisy, and the data are too sparse and (sadly) too low quality. But we can still assess whether the errors in the model estimates were small enough to warrant confidence in that model, and make its application useful and worthwhile.

With that said, here are the criteria I’m going to be using to evaluate the performance of my model on Election Day.

  1. Do the estimates of state opinion trends make sense? Although we won’t ever know exactly what people were thinking during the campaign, the state trendlines should at least pass through the center of the data. This validation also includes checking that the residual variance in the polls matches theoretical expectations, which so far, it has.
  2. How large is the average difference between the state vote forecasts and the actual outcomes? And did this error decline in a gradual manner over the course of the campaign? In 2008, the average error fell from about 3% in July to 1.4% on Election Day. Anything in this neighborhood would be acceptable.
  3. What proportion of state winners were correctly predicted? Since what ultimately matters is which candidate receives a plurality in each state, we’d like this to be correct, even if the vote share forecast is a bit off. Obviously, states right at the margin (for example, North Carolina, Florida, and Colorado) are going to be harder to get right.
  4. Related to this, were the competitive states identified early and accurately? One of the aims of the model is to help us distinguish safe from swing states, to alert us where we should be directing most of our attention.
  5. Do 90% of state vote outcomes fall within the 90% posterior credible intervals of the state forecasts? This gets at the uncertainty in the model estimates. I use a 90% interval so that there’s room to detect underconfidence as well as overconfidence in the forecasts. In 2008, the model was a bit overconfident. For this year, I’ll be fine with 80% coverage; if it’s much lower than that, I’ll want to revisit some of the model assumptions.
  6. How accurate was the overall electoral vote forecast? And how quickly (if at all) did it narrow in on the actual result? Even if the state-level estimates are good, there might be an error in how the model aggregates those forecasts nationally.
  7. Was there an appropriate amount of uncertainty in the electoral vote forecasts? Since there is only one electoral vote outcome, this will involve calculating the percentage of the campaign during which the final electoral vote was within the model’s 95% posterior credible interval. Accepting the possibility of overconfidence in the state forecasts, this should not fall below 85%-90%.
  8. Finally, how sensitive were the forecasts to the choice of structural prior? Especially if the model is judged to have performed poorly, could a different prior specification have made the difference?

If you can think of any I’ve left off, please feel free to add them in the comments.

Aftermath of the First Debate

Polls released since the first presidential debate last week indicate as rapid a shift in voter preferences as we’ve seen all campaign. My model estimates a swing of about 1.5% in Romney’s direction, or a net narrowing of about 3%. Although the polls also suggest that this movement began a few days before the debate, it’s still a large effect.

What to make of it? First, and most importantly, although Romney may have cut into Obama’s lead, Obama is still comfortably ahead. The most important state to win this year is arguably Ohio – and there Obama holds on to 51.7% of the major-party vote. According to my model, Obama had been outperforming the fundamentals (which point to his reelection) prior to the debate – and now he’s running just slightly behind them. As a result, the model’s long-term forecast continues to show an Obama victory, with 332 electoral votes.

Second, there’s reason to believe that the initial estimates of Romney’s post-debate surge are going to weaken as more polls are released today and tomorrow. The surveys that made it into my Sunday morning update consisted of a number of one-day samples, which tend to draw in particularly enthusiastic respondents – in this case, Republicans excited about Romney’s debate performance. Moreover, the survey methodology used by these firms – in which interviews are conducted using recorded scripts, to save time and money – also show a Republican lean. And if anything, my model gives slightly greater weight to automated polls simply because they tend to have larger sample sizes.

The point isn’t that these polls are “wrong” – only that this is a situation where it would be wise to wait for more information before reaching any strong conclusions. My model treats every poll equally, regardless of how it was fielded, or by whom. The reason I don’t try to “correct” for potential errors in the polls isn’t because I don’t believe they exist – but because I don’t believe those adjustments can be estimated reliably enough to make much of a difference. (Consider how wide the error bars are on Simon Jackman’s house effects estimates, for example.) Instead, I assume there will eventually be enough polling in all 50 states for these errors to cancel out. Usually that is a pretty safe assumption, but I don’t think it’s happened yet.

I’m going to embed the current trend estimates for Virginia and Florida here in this post, so we can compare them to later estimates, and see if I’m right.


Finally, making sense of this small batch of post-debate polls highlights the value of using an informative Bayesian prior. If Romney is really experiencing a sudden swing in the polls, then we already have some idea of how quickly that could reasonably happen, based on previous trends. It’s certainly possible that something about public opinion has fundamentally changed within the past week. But if that’s the case, we should require extra evidence to overturn what we previously thought was going on.

Look for another site update Tuesday morning.

Where Things Stand

If anyone tries to tell you the presidential race is close, don’t believe it. It’s just not true. With the debates beginning tomorrow, Obama’s September surge in the polls appears to have finally leveled off – but it has moved him into the lead in every single battleground state, including North Carolina.

If the election were held today, my model predicts Obama would get 52% of the major-party vote in Florida and 53% in Ohio. If Obama wins Florida, there’s almost no chance Romney can win the election. If Obama loses Florida but wins Ohio, Romney’s chances are only slightly higher.

Romney has to be hoping for a very large, and very consistent swing in opinion across a large number of states. The shift will have to be over 2% – which would be as big a change in voter preferences as we’ve seen during the entire campaign. And it will have to begin immediately. Post-RNC, it took just under one month for Obama to gain 1.5%-2% in the polls. Romney has just over one month to undo that trend, and more.

Looking for House Effects

There’s been a lot of talk lately about how the presidential polls might be biased. So let’s look at how well – or poorly – some of the major survey firms are actually performing this year.

All polls contain error, mainly from the limitations of random sampling. But there are lots of other ways that error can creep into surveys. Pollsters who truly care about getting the right answer go through great pains to minimize these non-sampling errors, but sometimes systematic biases – or house effects – can remain. For whatever reason, some pollsters are consistently too favorable (or not favorable enough) to certain parties or candidates.

Since May 1, there have been over 400 state polls, conducted by more than 100 different survey organizations. However, a much smaller number of firms have been responsible for a majority of the polls: Rasmussen, PPP, YouGov, Quinnipiac, Purple Strategies, We Ask America, SurveyUSA, and Marist.

For each poll released by these firms, I’ll calculate the survey error as the difference between their reported level of support for Obama over Romney, and my model’s estimate of the “true” level of support on the day and state of the poll. Then each firm’s house effect is simply the average of these differences. (Note that my model doesn’t preemptively try to adjust for house effects in any way.) If a firm is unbiased, its average error should be zero. Positive house effects are more pro-Obama; negative house effects are more pro-Romney. Here’s what we find.

Survey Firm # Polls House Effect
PPP 61 +0.7%
Marist 15 +0.5%
SurveyUSA 22 +0.3%
Quinnipiac 35 +0.1%
YouGov 27 0%
We Ask America 17 -0.2%
Purple Strategies 18 -0.9%
Rasmussen 53 -0.9%

There are a number of pieces of information to take away from this table. First, none of the house effects are all that big. Average deviations are less than 1% in either direction. This is much smaller than the error we observe in the polls due to random sampling alone.

Second, even if, say, Rasmussen is getting the right numbers on average – so that PPP’s house effect is actually +1.6% – then that +1.6% bias still isn’t that big. It’s certainly not enough to explain Obama’s large – and increasing – lead in the polls. Of course, it’s possible that even Rasmussen is biased pro-Obama, and we just aren’t able to tell. But I don’t believe anyone is suggesting that.

Finally, the firms with the largest house effects in both directions – PPP and Rasmussen – are also the ones doing the most polls, so their effects cancel out. Just another reason to feel comfortable trusting the polling averages.

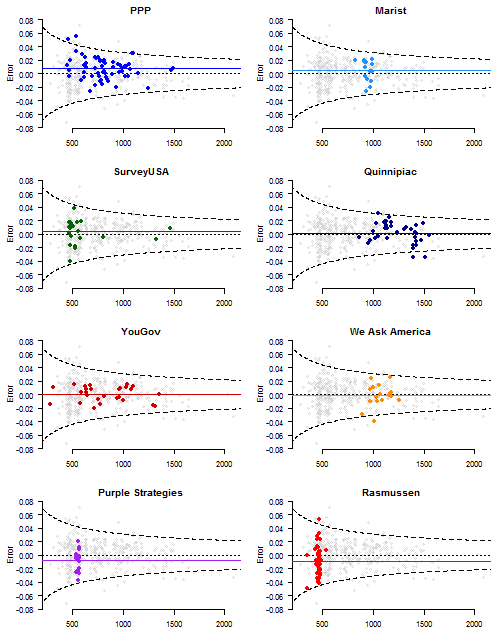
Here’s a plot highlighting each of the eight firms’ survey errors versus sample sizes. The horizontal lines denote the house effects. Dashed lines indicate theoretical 95% margins of error, assuming perfect random sampling. Again, nothing very extraordinary. We would expect PPP and Rasmussen to “miss” once or twice, simply because of how many polls they’re fielding.

Just out of curiosity (and no particular feelings of cruelty, I swear), which polls have been the most misleading – or let’s say, unluckiest – of the campaign so far? Rather than look at the raw survey error, which is expected to be larger in small samples, I’ll calculate the p-value for each poll, assuming my model represents the truth. This tells us the probability of getting a survey result with the observed level of error (or greater), at a given sample size, due to chance alone. Smaller p-values reveal more anomalous polls.

Here are all surveys with a p-value less than 0.01 – meaning we’d expect to see these results in fewer than 1 out of every 100 surveys, if the polling firm is conducting the survey in a proper and unbiased manner.

p-value Error Survey Firm Date State Obama Romney Sample Size
0.001 0.07 Suffolk 9/16/2012 MA 64% 31% 600
0.002 -0.07 InsiderAdvantage 9/18/2012 GA 35% 56% 483
0.003 -0.03 Gravis Marketing 9/9/2012 VA 44% 49% 2238
0.003 -0.05 Wenzel Strategies (R) 9/11/2012 MO 38% 57% 850
0.003 0.05 Rutgers-Eagleton 6/4/2012 NJ 56% 33% 1065
0.004 -0.04 FMWB (D) 8/16/2012 MI 44% 48% 1733
0.005 -0.05 Gravis Marketing 8/23/2012 MO 36% 53% 1057
0.006 -0.03 Quinnipiac 5/21/2012 FL 41% 47% 1722
0.009 -0.04 Quinnipiac/NYT/CBS 8/6/2012 CO 45% 50% 1463

The single most… unusual survey was the 9/16 Suffolk poll in Massachusetts that overestimated Obama’s level of support by 7%. However, of the nine polls on the list, seven erred in the direction of Romney – not Obama. And what to say about Gravis Marketing, who appears twice – strongly favoring Romney – despite only conducting 10 polls. Hm.

It’s interesting that many of these surveys had relatively large sample sizes. The result is that errors of only 3%-4% appear more suspicious than if the sample had been smaller. It’s sort of a double whammy: firms pay to conduct more interviews, but all they accomplish by reducing their sampling error is to provide sharper focus on the magnitude of their non-sampling error. They’d be better off sticking to samples of 500, where systematic errors wouldn’t be as apparent.

« Older posts Newer posts »

© 2024 VOTAMATIC

Theme by Anders NorenUp ↑