Polling Analysis and Election Forecasting

Category: Uncategorized (Page 6 of 7)

New Feature: State Trend Details

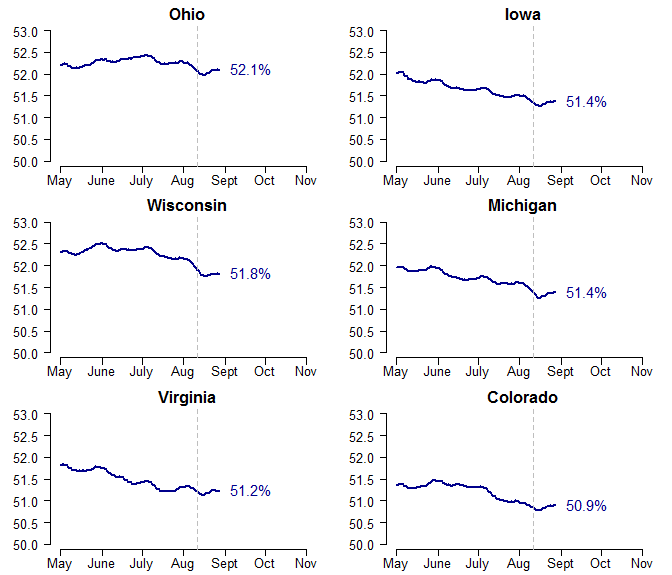
I’ve added a new feature to the site to give us a better look at the state-by-state trends in voter preferences during the campaign. These can be found at the State Trend Detail link, for both Obama and Romney (though the two trends will be mirror images of one another). As I noted on Tuesday, the data indicate that Romney has been slowly, but steadily, gaining on Obama across a broad range of states since May.

Since there’s been so little overall change in public opinion so far, these trends are nearly impossible to see on the original Poll Tracker page. Those plots use a consistent – but very wide – vertical scale, which emphasizes the differences between, rather than within, the states. In the State Trend Detail, the ranges of the vertical axes are much narrower – and vary by state – to focus on where, and to what extent, attitudes are shifting within states. The Poll Tracker page still provides a broader view of the spread of the polls themselves.

Importantly, it doesn’t seem that there’s been any defining campaign event that could be responsible for these trends. The erosion in support for the president has been extremely incremental. The old standby explanation is that undecided voters are increasingly paying attention to the campaign, and cluing into the mediocre state of the economy. Absent (sadly!) any hard data on state-by-state campaign spending, this seems reasonable enough. I’m eager to see what the next few days of polling indicate about the effects of the RNC. Hopefully there will be some new post-convention polls out by Monday or Tuesday, so look for another update then.

Finally, a bit of housekeeping. The BEA released their second estimate of Q2 GDP growth on Wednesday: 1.7%, updated from 1.5% in the original report. Results from the next run of the model (which should be posted by tomorrow) will use this number for the baseline projection of Obama’s two-party vote share, which tics up slightly from 52.3% to 52.4%.

Romney’s Trending… Slowly

With the Republican National Convention starting today, the Romney campaign has got to be hoping for a modest convention bounce to finally push them ahead of President Obama in the polls. Obama’s lead has held steady for months – and the conventional wisdom is that voter preferences have been unusually stable this year, perhaps due to an increasingly polarized electorate, voters’ closer familiarity with the candidates, or even simply that a lot of voters have already made up their minds.

Whatever the reason, here’s a case where the conventional wisdom is right… well, mostly. It’s true that we haven’t seen anywhere near the volatility that occurred during the Republican presidential primaries, for example. But, Mitt Romney has been slowly cutting into Obama’s lead over the past few months. It’s a bit hard to see on the poll tracker page, because the magnitude of the trend is so small – only about 0.5% in an average state. It’s definitely there, though. And the effect has been largest – between 0.7% and 0.8% – in a set of states you may recognize: New Hampshire, Iowa, Wisconsin, Michigan, Minnesota, Montana, Virginia, and Colorado – swing states where Obama is ahead by only a couple of points.

We can zoom in on some of these states to see the pattern more clearly. I’ll include Ohio as well, where the size of the trend has been somewhat smaller. Here I’m plotting only the estimated percent supporting Obama, over time. The vertical dashed line corresponds to August 11, when Romney announced Paul Ryan as his vice-presidential nominee. It appears that the movement away from Obama started much earlier than that. And if anything, the decline in support for Obama has leveled off – or even rebounded – following the Ryan pick.

How am I getting such detailed trends from such limited, state-level only, polling data? Compare my Virginia trendline to the trackers at HuffPost-Pollster or TPM. One trick is that I’m setting aside undecided voters, which are basically just noise. But the more significant feature of my model is that it is designed to simultaneously borrow information from the polls across all 50 states. When there are fewer polls in one state, polls in the other states help fill in the gaps, while still allowing each state to follow its own unique path. The model, in other words, adds a huge amount of statistical power to detect small effects. This is the benefit of an integrated modeling approach, and why (to put it plainly) 50 state series are more informative than one national series.

It will be interesting to see how things unfold over the next week, and whether Romney can accelerate this trend. This is just speculation, but I’m a bit skeptical that we’ll see a large GOP convention bounce. Hurricane Isaac is expected to hit New Orleans tonight. It’s already shaping up to be a major news event, including many, many comparisons to Hurricane Katrina in 2005. If people remember anything about Katrina, it’s probably going to be their own negative reaction to the government’s response to the disaster under Bush (e.g., here and here). Convention bounces happen because parties are treated to nearly uninterrupted positive coverage for days on end. Not only does Hurricane Isaac threaten to push the RNC out of the headlines, but in a way that’s framed negatively for the GOP. If Isaac turns out to be less destructive than Katrina – which seems likely after New Orleans spent seven years and $14 billion reinforcing its infrastructure – and President Obama is seen as handling the storm competently, then it wouldn’t surprise me if Romney doesn’t see a quick uptick in the polls as the convention wraps up.

Mitt Romney, Stuck in a Moment

The latest electoral vote forecast is unchanged at Obama 337 – Romney 201, but with today’s update, the uncertainty in those estimates decreases a bit. The main reason is another round of state polls showing Obama maintaining his lead in pivotal states like Florida, Pennsylvania, Ohio, and Wisconsin. But just as importantly, new polls in safe Romney states – including Arizona, Missouri, and North Dakota – also show no consistent up- or down-trends.

Taken together, these polls let us not only be more confident in current estimates of Obama’s standing, but also in the overall stability of the race up to this point. One of the ways my model projects forward to Election Day is by assessing the past volatility in voter preferences. If and when the polls begin to indicate more instability in voter preferences, more uncertainty will go back into the forecast. As I mentioned the other day, however, an unusually large proportion of voters are already saying they’ve made up their minds. It’s not as if nothing’s happening out on the campaign trail – only, none of it’s moving public opinion.

The bottom line is that Mitt Romney is facing a very large uphill climb right now. Every major survey aggregator is in agreement that Obama is ahead in current state-level polling – and many see the number of states in the tossup category dwindling. HuffPost has Obama at 290 electoral votes, with only Florida, North Carolina, and Virginia as tossups. Not to be outdone, TPM puts Obama at 310, with just two tossups – Virginia and Colorado. RCP is less aggressive, but still shows Romney needing to (nearly) run the table.

To put things in perspective, Romney could win Indiana, North Carolina, Colorado, Virginia, New Hampshire, Florida, and Iowa, and still lose the election. For Romney to rebound, something will have to happen over the next three months to either win over decided Obama supporters, or make undecided voters break overwhelmingly away from Obama – which evidence suggests could be a challenging proposition.

Q2 GDP Growth Released

The BEA released their first estimate of Q2 GDP growth today: 1.5%. This has been the key piece of missing information for the structural forecast I use as the starting point for my model. Until now, I’ve been relying on the Q1 growth rate, which is less strongly correlated with the election outcome. Starting with the next site update (either today or tomorrow), I will switch over to the model based on Q2 growth.

It’s helpful to have this new data point, but don’t expect a huge adjustment to the forecast. The Time-for-Change model using Q1 growth predicted that Obama would receive 52.6% of the two-party vote. With Q2 growth coming in at 1.5%, the baseline forecast falls all the way to… 52.3%. And this is before factoring in any adjustments from current polling.

In fact, the next update is also going to incorporate some important new polls. Two in particular stand out. First, we get a long-awaited reading in highly-competitive Missouri. The last polls in that state were done in late May/early June, and suggested a slight Romney lead. This latest survey indicates Romney is actually a few points farther ahead. Second, a poll in Illinois corroborates expectations of a large Obama lead there. So even though the forecast in Illinois won’t change that much, our certainty in it will increase considerably.

Stay tuned…

How to Follow the Campaign

Campaign reporters like to speculate about how events today will affect public opinion tomorrow. It’s the main way they justify why some new campaign tactic, news item, commercial, misstatement, gaffe, etc. is “important” or “matters” for the election. I appreciate that this is their job. But if public opinion is what we care about, why not just look at it directly? We have the data. So what are the polls telling us?

State-level presidential polls are now coming in at a rate of about one or two a day. And what’s happening is: Nothing. Voter preferences have been almost completely stable for nearly three months. The Obama lead we picked up on at the end of June is holding. The poll aggregators over at HuffPost Pollster and TPM are seeing the same thing. Nate Silver called it “The Incredibly Steady Presidential Race”. He’s right.

It wasn’t like this in 2008. In 2008, polling data showed a series of long-term, up-and-down trends in voters’ preferences for Obama vs. McCain. Support for Obama gradually declined all summer (leading to a bunch of “worried Democrat” stories like this one – really, one of my favorite genres of political reporting), then picked up around the Democratic convention, dropped off again following the Palin VP pick, and finally increased after the September financial crisis. Nothing like that has happened so far in 2012.

The question, of course, is will it? We still have three months to go. I’d be shocked if nothing happened between now and November. John Sides wrote about the primary factors to watch. But there are three considerations to keep in mind. First, even in relatively “volatile” 2008, voter preferences, by state, typically ranged just five to eight percent from their highest to lowest point over course of the campaign. Second, there are indications this year that an unusually large proportion of voters have already made up their minds. Voters are also saying they don’t have much more to learn about the candidates. Factor in (third) that current preferences are already very close to what the historical model is predicting, and we could be very nearly set.

Campaign news is entertaining, and it often feels like things that happen should matter. Don’t pay a lot of attention to the speculation. Watch the numbers. I’ll keep updating the site every few days. When public opinion starts to move, I’ll catch it. Then we can go back and look at what might have been the cause, and what it might mean going forward.

« Older posts Newer posts »

© 2024 VOTAMATIC

Theme by Anders NorenUp ↑