The results are in: Obama wins all of his 2008 states, minus Indiana and North Carolina, for 332 electoral votes. This is exactly as I predicted on Tuesday morning – and as I’ve been predicting (albeit with greater uncertainty) since June. Not bad! The Atlantic Wire awarded me a Gold Star for being one of “The Most Correct Pundits In All the Land”. There were also nice write-ups in The Chronicle of Higher Education, BBC News Magazine, Atlanta Journal-Constitution and the LA Times, among others. Thanks to everyone who has visited the site, participated in the comments, and offered their congratulations. I really appreciate it.
I’m still planning a complete assessment of the performance of the forecasting model, along the lines I described a few weeks ago. But in the meantime, a few quick looks at how my Election Day predictions stacked up against the actual state-level vote outcomes. First, a simple scatterplot of my final predictions versus each state’s election result. Perfect predictions will fall along the 45-degree line. If a state is above the 45-degree line, then Obama performed better than expected; otherwise he fared worse.
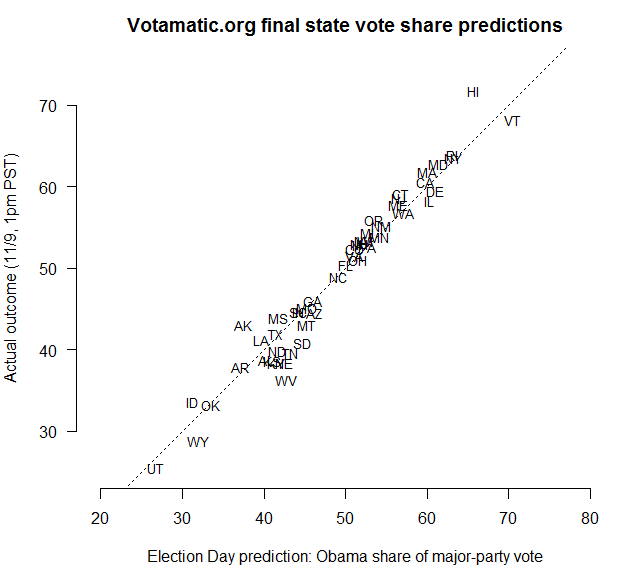
Interestingly, in most of the battleground states, Obama did indeed outperform the polls; suggesting that a subset of the surveys in those states were tilted in Romney’s favor, just as I’d suspected. Across all 50 states, however, the polls were extremely accurate. The average difference between the actual state vote outcomes and the final predictions of my model was a miniscule 0.03% towards Obama.
My final estimates predicted 19 states within 1% of the truth, with a mean absolute deviation of 1.7%, and a state-level RMSE of 2.3% (these may change slightly as more votes are counted). Other analysts at the CFAR blog and Margin of Error compared my estimates to those of Nate Silver, Sam Wang, Simon Jackman, and Josh Putnam, and found they did very well. All in all, a nice round of success for us “quants”.
Unsurprisingly, my model made much better predictions where more polls had been fielded! Here I’ll plot the difference between Obama’s share of the two-party vote in each state, and my final prediction, as a function of the number of polls in the state since May 1. Again, positive values indicate states where Obama did better than expected.
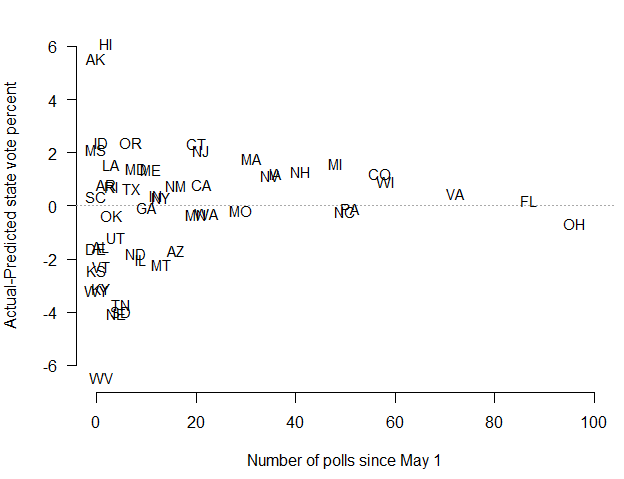
For minimizing the error in my forecasts, the magic number of polls per state appears to be around 25. That’s really not a lot; and I’m hopeful that we can get to at least this number in 2016. It’s a bit concerning, though, that there were about 25% fewer state-level presidential polls this year, compared to 2008.
Recently there have been some complaints among pollsters – most notably Gallup’s Frank Newport – that survey aggregators (like me) “don’t exist without people who are out there actually doing polls,” and that our work threatens to dissuade survey organizations from gathering these data in the first place. My view is slightly different. I’d say that working together, we’ve proven once again that public opinion research is a valuable source of information for understanding campaign dynamics and predicting election outcomes. There’s no reason why the relationship shouldn’t be one of mutual benefit, rather than competition or rivalry. In a similar manner, our analyses supplement – not replace – more traditional forms of campaign reporting. We should all be seen as moving political expertise forward, in an empirical and evidence-based way.

Again, congratulations on the accuracy of your predictions!
However, what you say at the end of your post is equally important: the quest for knowledge is a collective endeavor in which multiple approaches to gathering evidence (assuming that these methods are valid) will complement one another. Moreover, the concept of reliability itself involves replicating measurements, just as scientific verification involves replicating the outcomes of experiments.
It is not surprising that you and several other “quants” are professional educators. In fact, the discussions of statistical methods that have accompanied all these predictions (at 538, Princeton Election Consortium, etc.) are significant contributions to public discourse. Improving the level of understanding about the meaning of data and of quantitative analysis–that is to say, making us more “numerate”–is a worthy goal. Thank you for your achievement in this area, as well.
Congratulations! I found your site via PEC some months back and have been a regular reader ever since. I hope that you continue to blog even during the “down” times electorally-speaking.
Drew:
Can’t thank you enough for the work you did here. In addition to your predications being spot on, your methodology and explanations were incredibly useful and educational.
Once upon a time, in the mists of a long gone past, I was a PolSci major. Did a fair share of polling analysis, but nothing like this, that’s for sure.
Thanks again.
Congratulations on your great track record. It actually seems you also got the most accurate state margins compared to Fivethirtyeight, PEC and Pollster. At least in terms of the average absolute error in the swing states:
https://docs.google.com/spreadsheet/pub?key=0AgNq2v7u0JgOdEpPa0JSY040UmRRRkljS3pnVWJzcUE&output=html
Well done Sir. I salute you. For the longest time I though you were doing some wishful forcasting with Obama at 332. You were right. Very impressive. Thank you.
Hey look, you are famous now. :)
http://www.bbc.co.uk/news/magazine-20246741
Congrats. Well deserved.
As is likely the case, if your state-by-state win probabilities and margins are as accurate in the long-term as your EV prediction, you basically blew all of the other guys out of the water. In my aggregate of aggregates in 2016, I predict that your model will have higher weight than other models.
My daily ritual was first 538, then PEC, then votamatic, predicting Obama’s win in descending order. Frankly, I thought your prediction was an outlier, and I often reminded myself of that. Turns out you were dead on!
Here is what fascinates me. All my true blue Democratic Obama-phile friends (basically, all my friends) were nervous wrecks, despite the data looking so good. The Republicans were supremely confident, since they simply dismissed the data. Crazy, but I’ll take it.
Congrats on a job well done Drew!
Mr Linzer, Congratulations on your incredible performance.
Using the CFAR data for the swing states of NH, VA, NC, FL, PA, OH, WI, IA, CO, NV, and using updated values from Pollster for the election results, to 1 decimal place, the RMSE values for Obama vote share work out to:
Linzer: 0.637965516
Silver: 0.64807407
Putnam: 0.696769331
DeSart: 0.712741187
Wang: 0.751165761
Jackman: 0.820365772
And as the CFAR calculations of Brier scores shows:
As CFAR shows, Brier scores are:
Drew Linzer: 0.00384326
Wang/Ferguson: 0.007615686
Nate Silver: 0.00911372
Simon Jackman: 0.00971369
DeSart/Holbrook: 0.01605542
Again, incredible work. Bravo.
I found you late in this election. Thank you to 538 & PEC, who directed me to your site. It is ironic that a retired public school teacher of English and Social Studies (and a math illiterate) could find credible information and analysis but the Romney campaign and Republicans in general could not. Those of us who came to your site did not have to nail bite our way through the endless chatter about how this election was “too close to call”.
Congratulations. I keep marveling at the remarkable stability of your predictions. I hope you will find the time to write a bit more on that aspect of your analysis. The Time-for-change model seems like an exceptionally useful tool for generating the Bayesian prior of your analyses. Do you think that was fortuitous, or is it indeed as robust an algorithm as it appears to be?