Cross-posted at Daily Kos Elections
Last week, just before Election Day, we published our final presidential election forecast: Hillary Clinton, 323 electoral votes; Donald Trump, 215. As I wrote when making that prediction, “While it’s possible for Trump to defy the polls and win the election, it is not likely. Our model estimates Trump’s chances at around 12 percent.”
Trump’s Election Day victory, with 306 electoral votes, took us by surprise. My forecast was wrong. It’s time to understand why.
The forecast was based on a statistical model that analyzed nearly 1,400 state-level pre-election public opinion polls, in combination with a set of political and economic “fundamentals” that added information about the election’s historical context. The fundamental factors (which turned out to predict the national vote share very closely) indicated that Clinton faced an uphill climb from the very beginning. In May, I estimated that Clinton’s baseline probability of victory was around 35 percent.
But all summer long, right up to Election Day, the polls told a different story. Pollsters reported that Clinton was consistently ahead, both nationally and in the states, by what were sometimes very large margins. By July, Clinton’s advantage in the polls lifted her chance of winning to 65 percent, and it never fell below that mark. After the first presidential debate, Clinton’s lead over Trump in the state polls was so great that our model gave her a 96 percent chance of victory. And our reading of the polls was not unique: Every other major forecaster also expected Clinton to win (albeit with varying degrees of certainty). It would have taken either a major campaign event, or a major failure of public opinion measurement, for her to lose.
The polling failure was what we got. Late campaign developments like the Comey letter may have affected some voters, but if so, polls still never showed Trump in the lead. In previous elections, the error in the aggregates of the polls typically went both ways, sometimes benefiting the Democrat, and other times benefiting the Republican. This year, the errors were massive, and they almost all went in the direction of Trump.
State-level presidential polls—especially in the swing states—were badly and systematically wrong, by amounts not seen in decades. The polling averages indicated that Clinton would win Florida and North Carolina by 2 percentage points, Pennsylvania and Wisconsin by 5 percentage points, and Michigan by 7 percentage points. Instead, Trump won all five, for a total haul of 90 electoral votes. The state polls were so inaccurate that Trump almost won New Hampshire, where he’d been trailing by 5, and Minnesota, where he’d trailed by 9. Across all states, on average, Trump’s margin of victory was 5 percentage points greater than our polling aggregates expected it to be.
Given this data, no reasonable poll-based presidential forecasting model could have predicted a Trump victory. There was no interpretation of the available public polling data that supported that conclusion. This was not a case of confirmation bias or analysts reading into the data conclusions that they wanted to see. The evidence supporting a Trump victory did not exist.
The miss was not confined to the public polls, which are often considered to be of lower quality than the proprietary research commissioned by parties and campaigns, and never released to the public. Reports suggest that neither the Clinton nor the Trump campaign saw this result coming. Neither did the RNC. Going into Election Day, Trump campaign analysts calculated that they had at best a 30 percent chance of winning.
Some forecasting models did give Donald Trump a higher probability of winning; most notably the FiveThirtyEight model at 29 percent. But the reason why they saw Trump’s chances as being more likely was not because they had a fundamentally more pro-Trump interpretation of the data. Rather, they put less trust in the polls, which increased their uncertainty in the overall outcome of the election in both directions. This widened the range of potential electoral vote outcomes seen as consistent with the data—resulting in their forecast of Clinton’s chance of winning getting pulled back towards 50 percent. No matter the level of uncertainty in the final outcome, every poll-based model’s best guess was that Clinton would win the same set of states totaling 323 electoral votes, and every model was wrong in the same way.
It is not yet known why polls underestimated Trump’s vote share so badly. The polls also overestimated Clinton’s vote share, but not by nearly as much. Survey researchers are already busy investigating different theories. One clue, however, was that there was an unusually large number of survey respondents, all year, who said that they were either undecided or supporting a third-party candidate for president. I mentioned this pattern in my final forecast, and you can see it illustrated in the chart below:
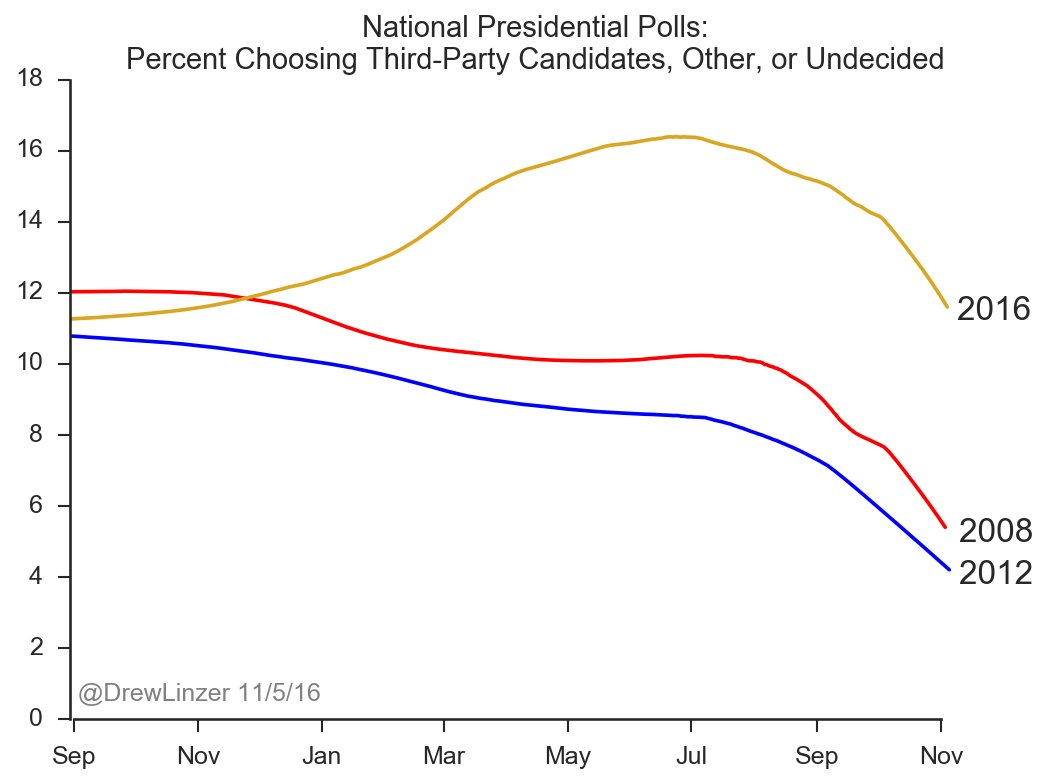
When as many as 12 percent of voters are uncommitted going into Election Day, it makes a big difference if they “break” disproportionately towards one candidate or the other. Nobody knows if there were significant numbers of so-called ”shy” Trump supporters who were uncomfortable telling pollsters they were backing Trump in this uncommitted bloc. But evidence from the exit polls suggests that many Trump voters “broke late,” and decided to support him only at the very last minute. Allowing for this possibility is something that should have contributed more uncertainty to most forecasters’ projections, including our own.
I checked whether the forecasts might have been wrong because one or two polling firms reported especially inaccurate results. That wasn’t the problem. In our database of state-level presidential polls, the two largest contributors were SurveyMonkey and UPI/CVoter, which together accounted for 29 percent of all polls. In many states, half or more of our data came from one of those two firms. I removed all of those polls from the dataset and re-ran the model. The results did not change in any meaningful way.
That so many people were caught off-guard by the election outcome suggests that the polling failure was a symptom of a deeper, industry-wide problem. Survey research is currently struggling through a difficult period of technological change. Fewer people than ever are willing to respond to polls, and those that do respond tend to be non-representative; older and more white than the population as a whole. Differential partisan non-response—in which the partisanship of people agreeing to take polls varies by their level of excitement in the campaign—causes poll results to swing wildly even if opinion is stable. This year, more polls than ever were conducted online, but the quality of online methodologies differs greatly across firms.
Despite these challenges, many media organizations and polling firms chose to undertake the hard work of surveying voters and releasing their results to the public, for free. There isn’t anyone who doesn’t wish the data had been more accurate. But those organizations who made the effort to contribute to public knowledge about the campaign by publishing their results deserve our gratitude and respect. Thank you. What we need in order to avoid a repeat of this surprising outcome in 2020 is not less pre-election polling, but more—by more firms, with different methodologies, and different viewpoints.