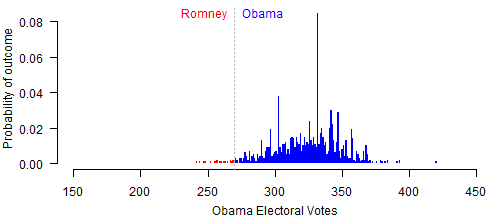
One of the key ways in which my forecasts could be wrong at this stage in the campaign is in the specification of prior beliefs over each state’s election outcome. These are the baseline historical forecasts I start out with, before updating from more recent polls. I’ve chosen to base my priors on a structural model that expects Obama to win 52.7% of the national major-party vote in 2012; or 1% less than what he received in 2008. As I wrote yesterday, this is already a fairly large margin of victory. It’s the main reason the model is producing probabilities of Obama’s reelection over 95%.
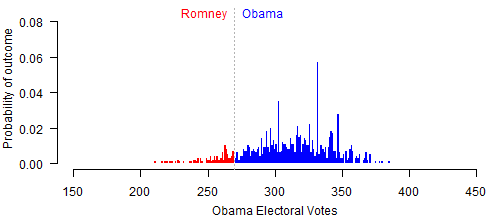
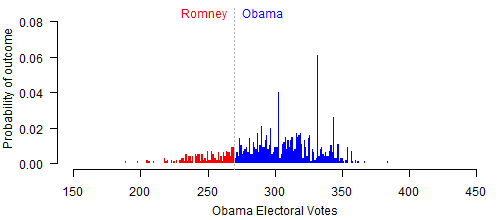
But what if the historical forecast is off? To answer this, we can run the model using a baseline forecast lower than the 52.7% I’m putting my faith in now. Suppose we had reason to believe that Obama’s national vote share will fall by 2%, down to 51.7%; or by 3%, down to 50.7%.
At 52.7%, we get what’s currently showing up on the site: a 97% chance of victory for Obama, with a median electoral vote forecast of 328.

At 51.7%, Obama’s probability of winning falls to 89%, with a median forecast of 314 electoral votes.

Finally, at 50.7%, Obama’s probability of winning is still, perhaps, surprisingly high: 81%, with 303 electoral votes.

What’s sustaining these chances is how well Obama has consistently been doing in the state polls. According to current estimates, Obama is way ahead in states like Pennsylvania, Oregon, Ohio, and Wisconsin. He also has the lead in closer states, such as Virginia, Michigan, and Colorado.
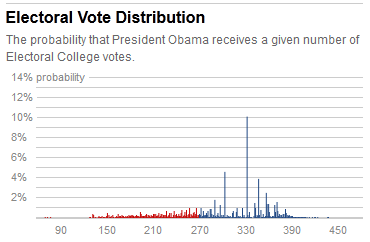
Let’s make one more comparison. Over at FiveThirtyEight, Nate Silver does a very similar electoral vote simulation to compute the probability of an Obama or Romney victory (although based on a very different model). Here’s his histogram as of today.

It actually looks fairly similar to my current simulation results (the first histogram above), with a 10% spike at 332, and a 4.5% spike at 303. The big difference with his is that there’s almost nothing in between! Instead, he finds a long left tail, with Obama having a small but consistent probability of winning anywhere from 270, down past just 150 electoral votes. That’s Bob Dole territory.
It’s this extended left tail that lets Silver conclude that Romney has even a 35% chance of winning right now. Silver also calculates his electoral vote forecast as the mean, rather than the median (as I do) of his simulation results. This is how he gets a forecast of 292.3 electoral votes for Obama. If he used the median, it would quite a bit higher. And if he filled in that empty space on the Obama side of the histogram, I imagine his probabilities of an Obama reelection would be pretty close to mine.

Frankly, I think the long tail at this early date makes the forecast look more plausible, not less. There’s definitely a small but worthwhile-to-include chance of some sort of big election-shifting event (scandal, disaster, etc.). Even if you reckon it’d have to be a once-in-a-half-century surprise, that still puts 4% probability mass in each tail.
My gut reaction is that such an event would be slightly more likely to be to the incumbent’s detriment, but that’s just a guess.
No idea what’s causing the lack of probability mass in the 304-331 range, though. The subset-of-states (regional, etc.) correlations in his model? Hm.