• Is 99% Too High?

    by  • June 27, 2012 • 9 Comments

    That depends on whether you believe the historical model. Of all the numbers on this site – and there are a lot of them – the one that may be most eye-catching right now is the high probability my model places on Obama’s chances for re-election. Whether that probability is 99%, 95%, or 90% (there will be blips up and down), the point is that the model is very confident in forecasting an Obama victory.

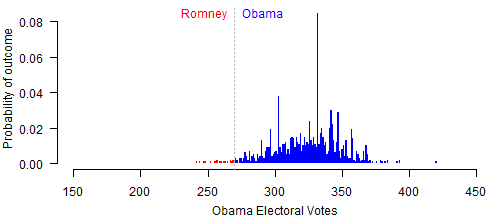
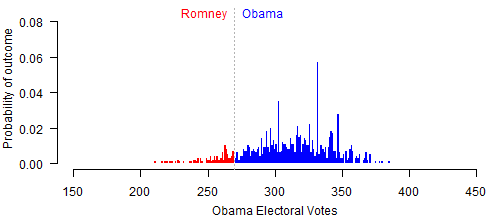
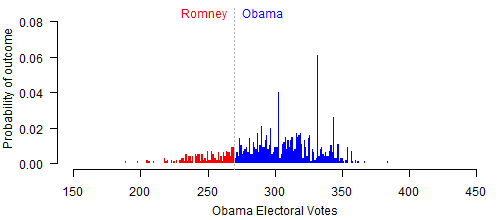
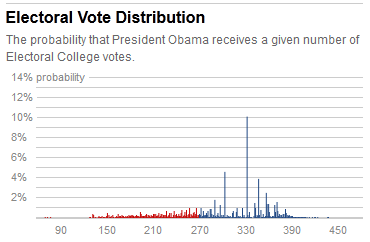
    Is 99% too high? Given the current polling data, and how this year’s fundamentals compare to those of previous presidential elections, I don’t think it is. The baseline forecast I am working from estimates that Obama will win 52.7% of the national (two-party) vote right off the bat. When translated to the state level, combined with current polls, then converted into electoral votes, the median forecast is Obama 328 – Romney 210. There’s actually quite a bit of uncertainty around these estimates, though. The model indicates that with 90% probability, Obama’s electoral vote total could be anywhere from 281 (e.g., Bush vs. Kerry) to 367 (e.g., Clinton vs. Bush). The entire range of simulated Obama electoral votes is roughly 225 to 425. The reason the model is so confident is not because the uncertainty in the estimates is too small, but because the underlying data are tilted so far in Obama’s direction.

    That said, this does not mean that the forecasts are fixed, or that the election is over. The key to my approach is that it is dynamic: when older forecasts conflict with newer polling data, it updates the estimates automatically. At some point in the campaign – whether it’s one week before the election, one month, or even now – the model predictions will be correct (that is, at least, as long as the polls are accurate, which I sure hope they will be). What we won’t know until Election Day is how quickly the model got us to the right answer.

    In fact, the biggest missing piece at the moment is not more polls, but rather the Q2 economic data. By necessity, I’m still relying on Q1 data, even though they are historically less predictive. As soon as the Q2 numbers are released, I will recalculate the baseline structural forecast, and continue updating from there. That’s been the plan all along. (…but if Q2 growth is around 2% – as some expect – the baseline forecast will end right back up at 52-53%.)

    So just as you wouldn’t look at the weather forecast a week ahead, then not re-check the day before, the model is telling us how things look right now, subject to new information later on. It’s not impossible for Romney to win, and I’m not guaranteeing an Obama victory. But, barring any major, historically exceptional turn of events, it’s very reasonable to think that Obama has a very, very good chance of winning in 2012.

    Early Returns

    by  • June 27, 2012 • 3 Comments

    It’s still early, but a few patterns seem to stand out so far.

    1. Obama should be in a comfortable position for re-election. The structural forecast I’m using indicates that he’s on track to win between 52% and 53% of the national vote. There’s nothing in the state polls that strongly contradicts this right now. When combined with the current polling and run through the state-level model, this translates to a 90% chance Obama will win between 281 and 367 electoral votes. He only needs 270.

    2. There are a few states where the early polling suggests a larger than expected falloff for Obama. The biggest ones are Michigan, Oregon, Wisconsin, Arizona, and… Utah. He still has a strong chance to win Michigan, Oregon, and Wisconsin, but the vote shares could be down by 3-6% from 2008, instead of just the 1% (on average) predicted by the structural model. (On the other hand, Obama is doing much better than expected in Massachusetts.)

    3. There’s a lot of stability in the state-level opinion trends. Since most states haven’t been polled much so far, this wouldn’t be as apparent if we were only looking one state at a time. But the model is designed to pick up common trends across states. It does appear that there’s been some slight movement in Romney’s direction since May; look at Virginia, for example. This pattern is also consistent with national trends. They were just talking about this on First Read this morning.

    Forecasting 2012

    by  • June 26, 2012 • 2 Comments

    Welcome to the new site. I’ll start with some background. About a year ago, I started circulating a research paper describing a statistical model for forecasting presidential elections and tracking voter preferences at the state level. The model gives us a way to combine data from past elections with the results of every new state-level poll, as they’re released, in real time. When I tested it out on the pre-election polls from 2008, it quickly and accurately predicted an Obama victory, and clearly outperformed projections based on historical factors alone.

    I’ve set up this site to keep track of what’s happening in 2012. As we get closer to Election Day, more polls will come out, and we’ll have a better sense of who’s likely to win. The trick is that there are some things we’d like to know right now: not only the probable election winner, but also which states are going to be competitive, and how voter preferences are changing over time. This is what my model tells us, for every state, on every day of the campaign. I then aggregate the state results to see who’s ahead in the Electoral College, and calculate each candidate’s probability of victory.

    As new polls become available, estimates on the site will update automatically, usually daily. The top banner will contain the current national forecasts, as well as the trend in past forecasts, so you can see if there are any sudden shifts or changes (there shouldn’t be), or if newer polling data are causing a reassessment of earlier predictions. The forecast tracker page shows the same information for all 50 states. On the forecast detail page, you’ll find the most up-to-date state forecasts, as well as the distribution of potential electoral vote outcomes. The poll tracker page will show smoothed trends in preferences for Obama vs. Romney up to the most recent day. For more on the model itself, there’s a separate page on how it works.

    I’ll also be chiming in here now and then. But check back anyway. Even if I don’t have anything new to say, the site will continue to update to reflect the latest polls.