With the pace of polling increasing, there are going to be days when some polls seem to be especially surprising – or even contradictory. For example, a recent Washington Post survey found Obama up 8 points in Virginia, even though other polls indicate a tighter race. It’s pretty safe to say that Obama is not actually winning Virginia by 8 points. But this doesn’t mean the Post poll is biased, or wrong, or should be ignored. I imagine the Post did the best job they could. The likeliest explanation for the finding is simply random sampling error.
Even in a perfectly executed survey, there’s going to be error due to random sampling. A survey only contacts a small group of respondents, and those people won’t always be representative of the broader population. The smaller the sample, the larger the sample-to-sample variability. To see just how large sampling error can be, suppose my model is correct that Obama is currently preferred by 52% of decided, major-party voters in Virginia. Then in different surveys of 750 respondents (which is about the average size of the state polls), it wouldn’t be unusual to see results ranging anywhere from 48% to 56%, because of sampling variation alone. In fact, here’s the expected distribution of all poll results under this scenario: most should be right around 52%, but many won’t.
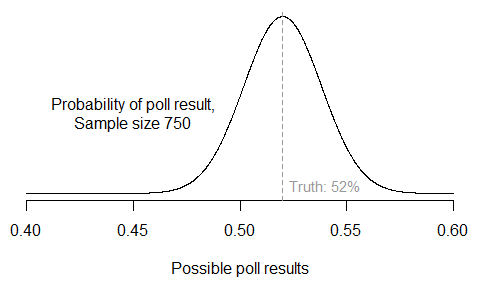
If we added in other possible sources of survey error (question wording, interviewer effects, mode effects, sample selection, and so forth), the distribution would become even wider. So just imagine two polls on the same day showing Romney with either 52% or 60% of the two-party vote. Astounding, right? No, not really. It happened in Missouri last week.
What is actually astounding about the polls this year is how well they are behaving, compared to theoretical expectations. For a given sample size, the margin of error tells us how many polls should fall within a certain range of the true population value. I’ll assume my model is correctly estimating the current level of preference for Obama over Romney in each state during the campaign. Then I can subtract from each observed poll result the model estimate on that day. This is the survey error. It turns out that most polls have been exactly where they should be – within two or three points of the model estimates. And that’s without any correction in my model for “house effects,” or systematic biases in the results of particular polling organizations.
Plotting each poll’s error versus its sample size (excluding undecideds) produces the following graph. The dashed lines correspond to a theoretical 95% margin of error at each sample size, assuming that error arises only from random sampling.
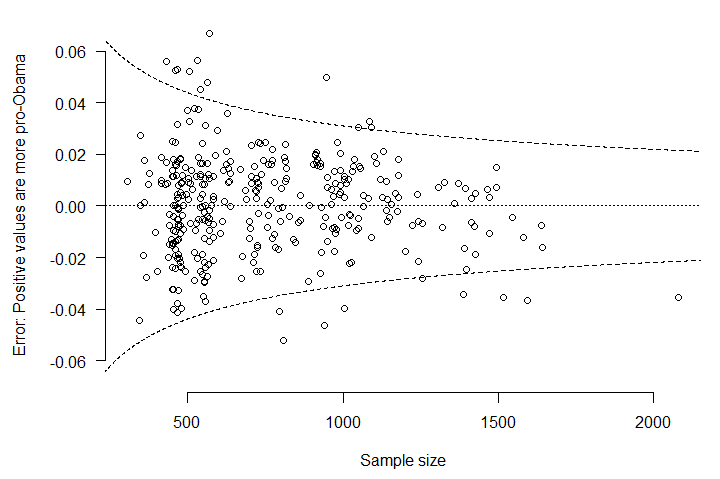
If the model is fitting properly, and if there are no other sources of error in the polls, then 95% of polls should fall within the dashed lines. The observed proportion is 94%. Certainly some polls are especially misleading – the worst outlier, in the lower right corner, is the large 9/9 Gravis Marketing poll that had Romney ahead in Virginia (and was singly responsible for the brief downward blip in the Virginia forecast last week). But what is most important – and what helps us trust the pollsters as well as their polls – is that the overall distribution of survey errors is very close to what we would expect if pollsters were conducting their surveys in a careful and consistent way.
Hey great blog and site. Too few of the poll-oriented sites talk about distributions or show confidence intervals in their graphics. You do both. More of the that, please! You analyzed the 95% confidence interval in this post, but how about testing at a few other intervals, say 50% and 10%?
BTW – you should add a caption to your forecast tracker which indicates that the ranges show show 95% probability, just as you do on the forecast detail graphics.
Mike, thanks – I’ll have more to say about this soon. Just quickly, though, the theoretical 50% and 90% intervals match the data as well. I’ll go ahead and stick that note on the bottom of the forecast tracker page.
Nice post. Makes perfect sense but, it doesn’t answer the question of the day: what is will be the party turnout model on election day?
If every poll assumes pretty much the same party ID then we would assume a convergence of results – as you pointed out. BUT if party ID is not as assumed; if party ID reverts to 2004 or stays at 2010 levels then the polls are flat-out wrong.
Well, nobody knows. And party ID is something that itself fluctuates from year to year.
I think the safest thing to do is simply assume that the pollsters are doing their best to randomly sample the target population, period. Their incentives are to be as accurate as possible, after all. Seeing as how the polls are distributed properly around the mean, it doesn’t make sense to me that the polling firms – many of whom are Republican – are all colluding around some biased pro-Obama target.
Contrary to the lay assumption, pollsters do not (generally) use party weighting at all, let alone the same model. You ask the question and report the answers, but that’s it. Weighting generally involves voter intent and intensity, or demographics like sex, age, and race.
Rasmussen is the only exception of which I’m currently aware.