Questions continue to be raised about the accuracy of the polls. Obviously, in just a few more days, we’ll know which polls were right (on average) and which were wrong. But in the meantime, it’s useful to understand how the polls are – at the very least – different from one another, and form a baseline set of expectations to which we can compare the election results on Tuesday. The reason this question takes on special urgency now is that there’s essentially no time left in the campaign for preferences to change any further: if the state polls are right, then Obama is almost certain to be reelected.
In previous posts, I’ve looked at both house effects, and error distributions (twice!), but I want to return to this one more time, because it gets to the heart of the debate between right-leaning and left-leaning commentators over the trustworthiness of the polls.
A relatively small number of survey firms have conducted a majority of the state polls, and therefore have a larger influence on the trends and forecasts generated by my model. Nobody disputes that there have been evident, systematic differences in the results of these major firms: some leaning more pro-Romney, others leaning more pro-Obama. As I said at the outset, we’ll know on Election Day who’s right and wrong.
But here’s a simple test. There have been hundreds of smaller organizations who have released fewer than a half-dozen polls each. Most have only released a single poll. We can’t reliably estimate the house effects for all of these firms individually. However, we can probably safely assume that in aggregate they aren’t all ideologically in sync – so that whatever biases they have will all cancel out when pooled together. We can then compare the overall error distribution of the smaller firms’ surveys to the error distributions of the larger firms’ surveys. (The survey error is simply the difference between the proportion supporting Obama in a poll, and my model’s estimate of the “true” proportion on that state and day.)
If the smaller firms’ errors are distributed around zero, then the left-leaning firms are probably actually left-leaning, and the right-leaning firms are probably actually right-leaning, and this means that they’ll safely cancel each other out in my results, too. On the other hand, if the smaller firms’ error distribution matches either the left-leaning or the right-leaning firms’ error distribution, then it’s more likely the case that those firms aren’t significantly biased after all, and it’s the other side’s polls that are missing the mark.
What do we find? This set of kernel density plots (smoothed histograms) shows the distribution of survey errors among the seven largest survey organizations, and in grey, the distribution of errors among the set of smaller firms. The smaller firms’ error distribution matches that of Quinnipiac, SurveyUSA, YouGov, and PPP. The right-leaning firms – Rasmussen, Gravis Marketing, and ARG – are clearly set apart on the pro-Romney side of the plot.
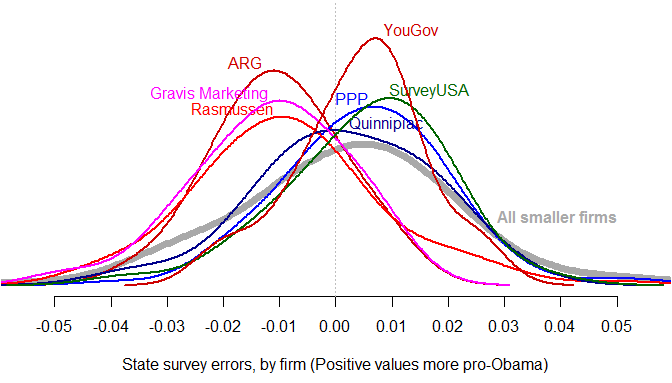
If, on Election Day, the presidential polls by Quinnipiac, SurveyUSA, YouGov, and PPP prove to be accurate, then the polls by Rasmussen, Gravis Marketing, and ARG will all have been underestimating Obama’s level of support by 1.5% consistently, throughout the campaign. Right now, assuming zero overall bias, Florida is 50-50. The share of Florida polls conducted by Rasmussen, Gravis Marketing, and ARG? 20%. Remove those polls from the dataset, and Obama’s standing improves.
Four days to go.