There’s a general consensus among poll-watchers that Obama is currently ahead in most – if not all – of the battleground states. How likely is this lead to hold up through Election Day? And what range of outcomes are realistic to expect? Let’s set aside the forecasts being produced by my model (which combine the polls with certain assumptions about long-term election fundamentals), and instead just walk through a few different scenarios starting from where preferences stand today.
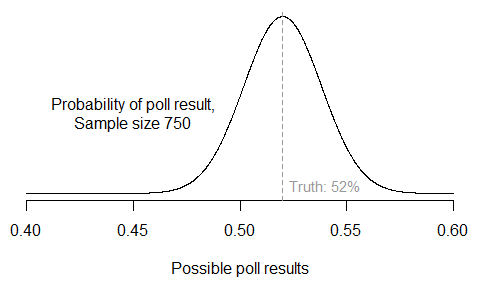
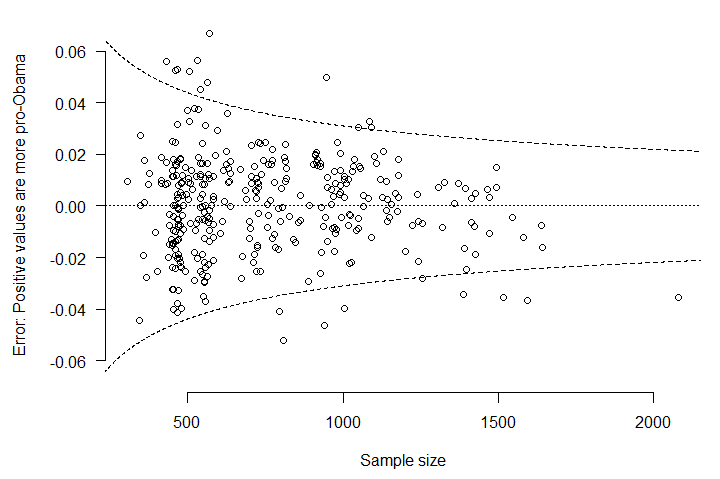
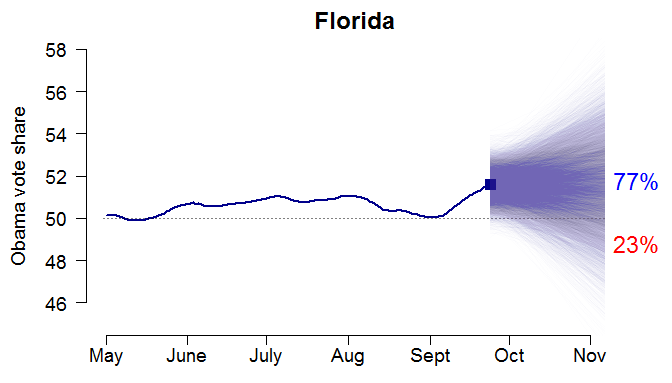
I start by accounting for uncertainty in the current level of support for Obama and Romney in each state. The idea is simply that we have better estimates of public opinion in states that have been polled more frequently. From the model results, I simulate 10,000 plausible “states of the race” for all 50 states.
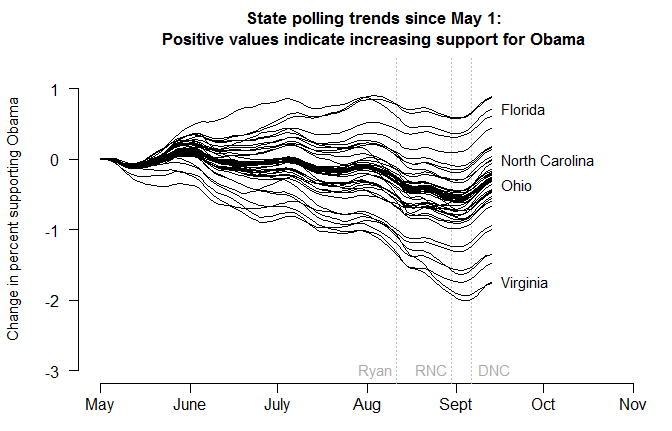
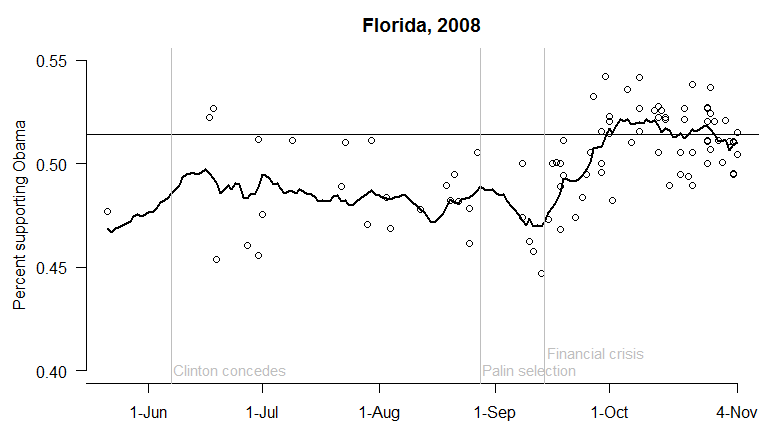
Next, we have to make some guesses about how voter preferences might change between now and Election Day. So far, state-level opinion has been fairly stable; only varying within a 1%-2.5% range. Since Obama is ahead right now, the less we believe preferences are going to fluctuate over the next six weeks, the worse for Romney. So let’s generously assume that with 95% probability, voters might swing as much as 4% in either direction from their current spot, with a modal change of zero.
Here’s what the combination of these two assumptions would look like in Florida. (Recall all percentages exclude third-party candidates and undecideds.) There’s some initial variation around today’s estimate (the square); then the potential future changes are added in. The result is a 77% chance of Obama winning Florida – that is, 77% of the 10,000 simulations result in an Obama two-party vote share above 50%.
Finally, to extend the simulation to all 50 states, we have to consider that future changes in state opinion are not likely to be independent. In other words, if Romney starts doing better in Florida, he’s probably going to improve in North Carolina, Virginia, Ohio, etc. as well. So we want to build in some correlation between the state trends. Perfect correlation would be equivalent to “uniform swing” in which a constant amount is added to (or subtracted from) each state’s current estimate. The lower the correlation, the more the future state trends differ from one another.
Let’s try a moderate level of inter-state correlation: 0.8 on the range from 0 to 1. I generate 10,000 hypothetical election outcomes in all 50 states, and add up the number of electoral votes Obama receives in each. The result is a 92% chance of victory for Obama, with a median outcome of 347 electoral votes. This would be Obama winning all of his 2008 states, except for Indiana.
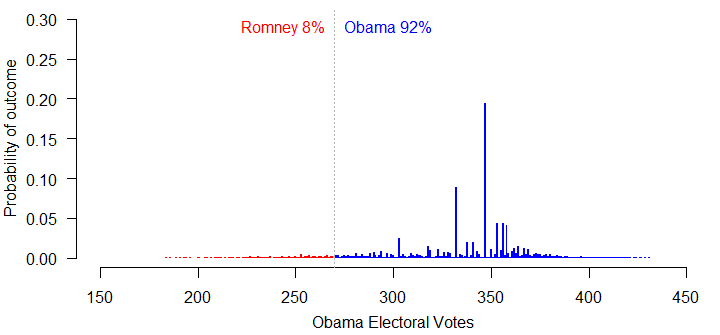
If we increase the correlation between states all the way to 1, Romney’s chances of winning are still just 10%. What’s going on? Obama’s lead in the polls is so large right now, that he could lose 2.5% of the vote in every single state and still have enough support to clear 270 electoral votes. The chances of him slipping more than that, if current trends continue, are slim.
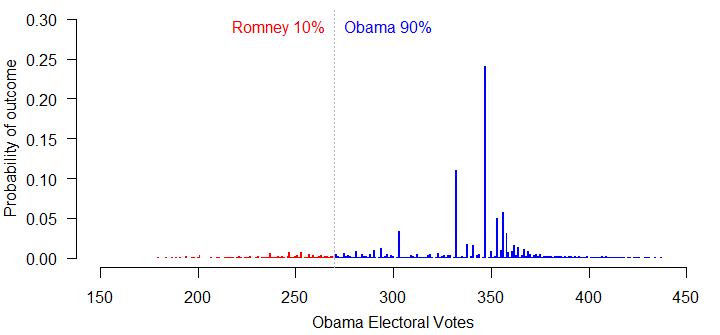
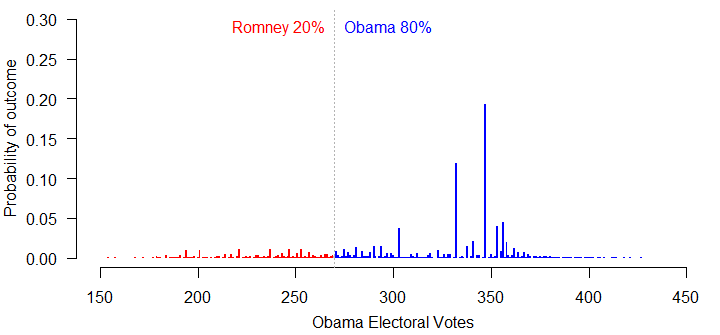
One possibility is that the polls are all biased in Obama’s favor, and have been systematically overstating his level of support. Suppose we knock 1% off the model’s current estimates in each state and re-run the simulation, assuming perfect uniform swing. In that case, Romney’s chances improve to 20%.
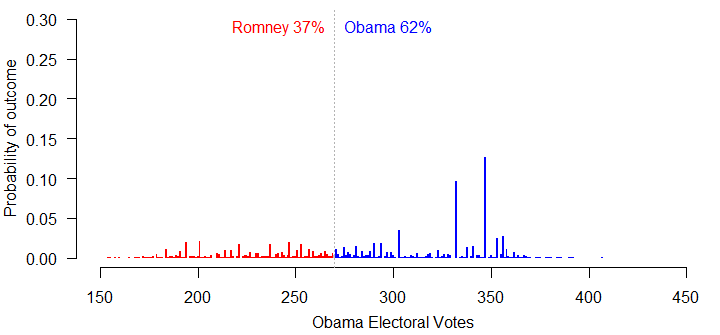
If the polls are all biased 2% in Obama’s favor, the simulation moves Romney up to a 37% chance of winning – still not great, but at least better than 8%.
No wonder the Republicans are starting to challenge the polls. Unfortunately, there’s no serious indication that the polls are behaving strangely this year.
