With the Republican National Convention starting today, the Romney campaign has got to be hoping for a modest convention bounce to finally push them ahead of President Obama in the polls. Obama’s lead has held steady for months – and the conventional wisdom is that voter preferences have been unusually stable this year, perhaps due to an increasingly polarized electorate, voters’ closer familiarity with the candidates, or even simply that a lot of voters have already made up their minds.
Whatever the reason, here’s a case where the conventional wisdom is right… well, mostly. It’s true that we haven’t seen anywhere near the volatility that occurred during the Republican presidential primaries, for example. But, Mitt Romney has been slowly cutting into Obama’s lead over the past few months. It’s a bit hard to see on the poll tracker page, because the magnitude of the trend is so small – only about 0.5% in an average state. It’s definitely there, though. And the effect has been largest – between 0.7% and 0.8% – in a set of states you may recognize: New Hampshire, Iowa, Wisconsin, Michigan, Minnesota, Montana, Virginia, and Colorado – swing states where Obama is ahead by only a couple of points.
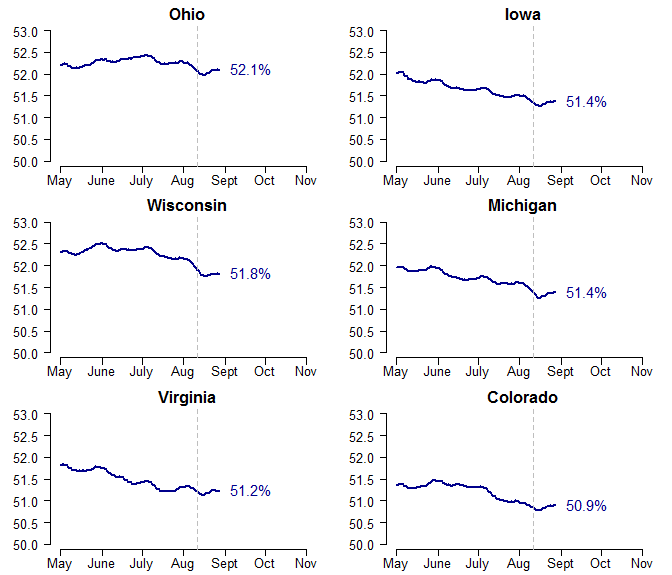
We can zoom in on some of these states to see the pattern more clearly. I’ll include Ohio as well, where the size of the trend has been somewhat smaller. Here I’m plotting only the estimated percent supporting Obama, over time. The vertical dashed line corresponds to August 11, when Romney announced Paul Ryan as his vice-presidential nominee. It appears that the movement away from Obama started much earlier than that. And if anything, the decline in support for Obama has leveled off – or even rebounded – following the Ryan pick.
How am I getting such detailed trends from such limited, state-level only, polling data? Compare my Virginia trendline to the trackers at HuffPost-Pollster or TPM. One trick is that I’m setting aside undecided voters, which are basically just noise. But the more significant feature of my model is that it is designed to simultaneously borrow information from the polls across all 50 states. When there are fewer polls in one state, polls in the other states help fill in the gaps, while still allowing each state to follow its own unique path. The model, in other words, adds a huge amount of statistical power to detect small effects. This is the benefit of an integrated modeling approach, and why (to put it plainly) 50 state series are more informative than one national series.
It will be interesting to see how things unfold over the next week, and whether Romney can accelerate this trend. This is just speculation, but I’m a bit skeptical that we’ll see a large GOP convention bounce. Hurricane Isaac is expected to hit New Orleans tonight. It’s already shaping up to be a major news event, including many, many comparisons to Hurricane Katrina in 2005. If people remember anything about Katrina, it’s probably going to be their own negative reaction to the government’s response to the disaster under Bush (e.g., here and here). Convention bounces happen because parties are treated to nearly uninterrupted positive coverage for days on end. Not only does Hurricane Isaac threaten to push the RNC out of the headlines, but in a way that’s framed negatively for the GOP. If Isaac turns out to be less destructive than Katrina – which seems likely after New Orleans spent seven years and $14 billion reinforcing its infrastructure – and President Obama is seen as handling the storm competently, then it wouldn’t surprise me if Romney doesn’t see a quick uptick in the polls as the convention wraps up.

Just as my gut intuition was with Nate Silver in 2008, I’m throwing my lot with Linzer this year. I completely agree that Nate has gotten off the rails with his minutiae of polling adjustments and dozen-component indicators. He also has not been transparent with retrospective predictions of his model. Linzer’s Bayesian framework is digestible, starts with a solid, historically validated prior and uses a clean pollgap filler (a unified national trend tracking component, instead of Silver’s regional and national-level one). It remains to be seen who has the more accurate prior though, Silver’s 16-variable state fundamentals regression (for which he became an overnight sensation one might note) or the clean Abramowitz-adjusted estimate.
Great post, Drew, as always.
Another aggregation website that I’ve liked since 2004 and still like is Sam Wang’s. http://election.princeton.edu/ . I’d be interested in seeing a comparison between your and Sam’s methodology (http://election.princeton.edu/methods/) After skimming his and your methodology, it looks like he relies more heavily on polls (I don’t see anything about a structural forecast prior), and it looks like he uses poll medians throughout. But I think both of you take advantage of polls in other states to make an estimate in a given state, and base your summary forecast on the median electoral vote rather than the average. I’m not sure if that’s all correct or if it captures the most meaningful similarities and differences. But the simulation distributions are similar. Maybe some of the time you would have spent doing APSA stuff you can spend on that.
P.S. I had to click through to the post to hit like. If you can put the like button on the home page, it will make it easier for fans to register their appreciation
Tyson, thanks. Sam Wang’s stuff is definitely interesting – I read him for more of an “outsider” perspective, but in a good way. He does rely on polls more heavily than I do. The big drawback to relying too heavily on polls is that every time the polls move – even if it’s just a temporary bounce – the forecasts are going to fluctuate too. I prefer an approach that’s more robust to those short-term ups-and-downs, and updates from the polls only gradually.
Also, I figured out how to add those buttons to the main page, so like away!