VOTAMATIC

Polling Analysis and Election Forecasting

Page 5 of 7

Projecting Ahead to Election Day

There’s a general consensus among poll-watchers that Obama is currently ahead in most – if not all – of the battleground states. How likely is this lead to hold up through Election Day? And what range of outcomes are realistic to expect? Let’s set aside the forecasts being produced by my model (which combine the polls with certain assumptions about long-term election fundamentals), and instead just walk through a few different scenarios starting from where preferences stand today.

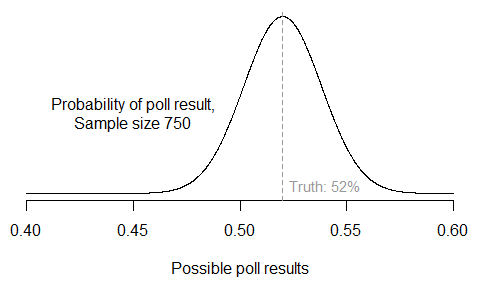
I start by accounting for uncertainty in the current level of support for Obama and Romney in each state. The idea is simply that we have better estimates of public opinion in states that have been polled more frequently. From the model results, I simulate 10,000 plausible “states of the race” for all 50 states.

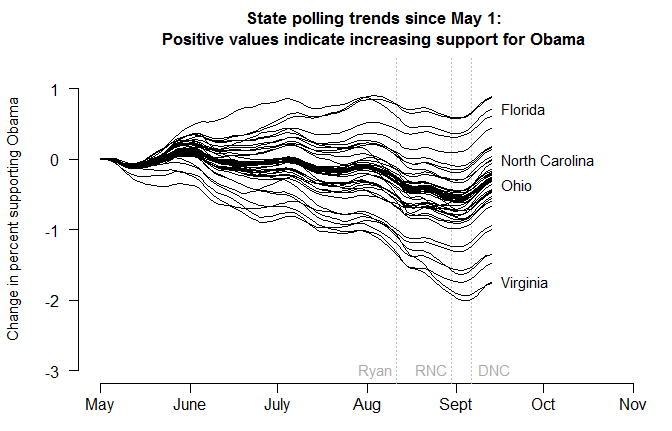
Next, we have to make some guesses about how voter preferences might change between now and Election Day. So far, state-level opinion has been fairly stable; only varying within a 1%-2.5% range. Since Obama is ahead right now, the less we believe preferences are going to fluctuate over the next six weeks, the worse for Romney. So let’s generously assume that with 95% probability, voters might swing as much as 4% in either direction from their current spot, with a modal change of zero.

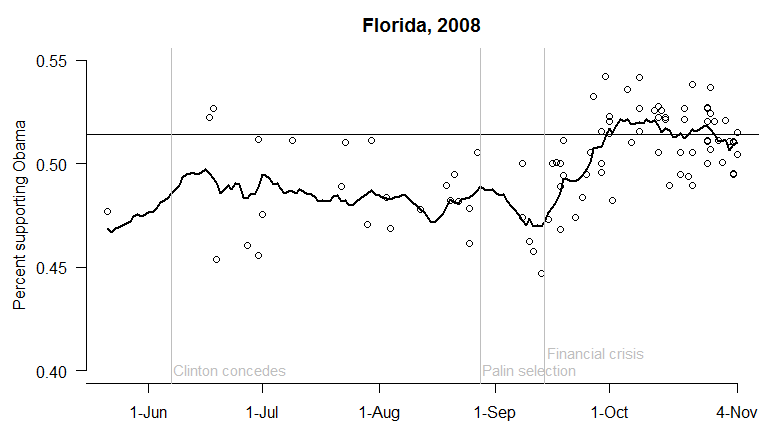
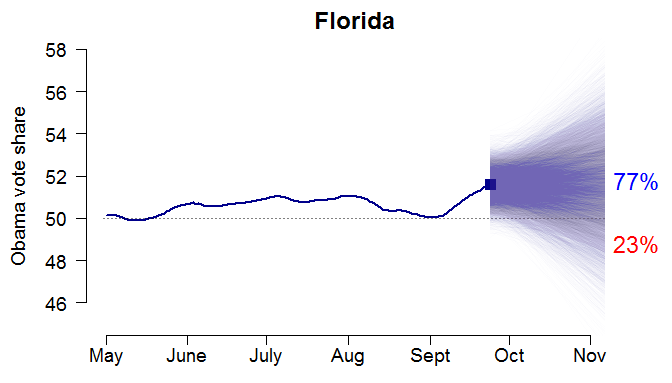
Here’s what the combination of these two assumptions would look like in Florida. (Recall all percentages exclude third-party candidates and undecideds.) There’s some initial variation around today’s estimate (the square); then the potential future changes are added in. The result is a 77% chance of Obama winning Florida – that is, 77% of the 10,000 simulations result in an Obama two-party vote share above 50%.

Finally, to extend the simulation to all 50 states, we have to consider that future changes in state opinion are not likely to be independent. In other words, if Romney starts doing better in Florida, he’s probably going to improve in North Carolina, Virginia, Ohio, etc. as well. So we want to build in some correlation between the state trends. Perfect correlation would be equivalent to “uniform swing” in which a constant amount is added to (or subtracted from) each state’s current estimate. The lower the correlation, the more the future state trends differ from one another.

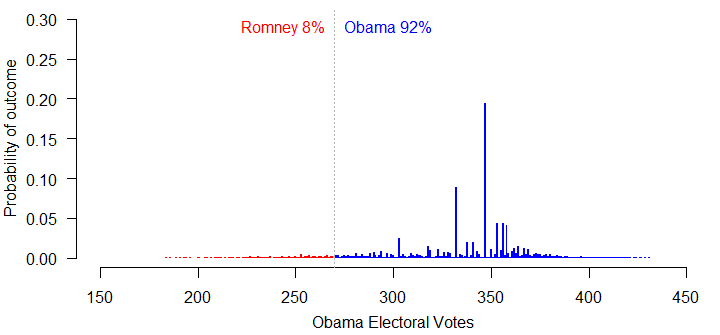
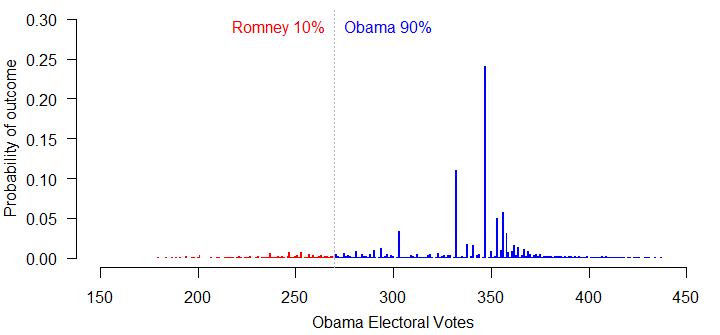
Let’s try a moderate level of inter-state correlation: 0.8 on the range from 0 to 1. I generate 10,000 hypothetical election outcomes in all 50 states, and add up the number of electoral votes Obama receives in each. The result is a 92% chance of victory for Obama, with a median outcome of 347 electoral votes. This would be Obama winning all of his 2008 states, except for Indiana.

If we increase the correlation between states all the way to 1, Romney’s chances of winning are still just 10%. What’s going on? Obama’s lead in the polls is so large right now, that he could lose 2.5% of the vote in every single state and still have enough support to clear 270 electoral votes. The chances of him slipping more than that, if current trends continue, are slim.

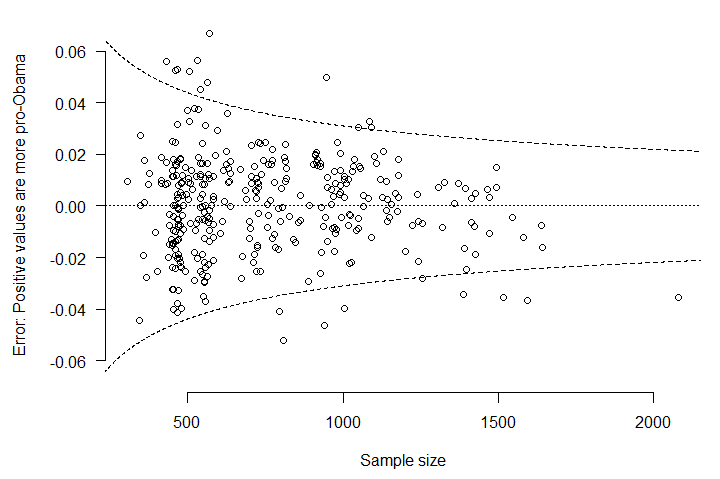
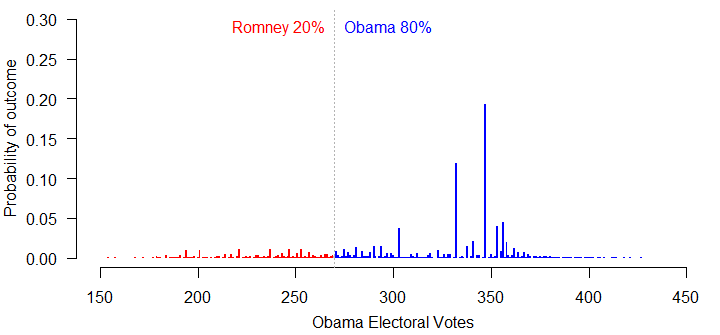
One possibility is that the polls are all biased in Obama’s favor, and have been systematically overstating his level of support. Suppose we knock 1% off the model’s current estimates in each state and re-run the simulation, assuming perfect uniform swing. In that case, Romney’s chances improve to 20%.

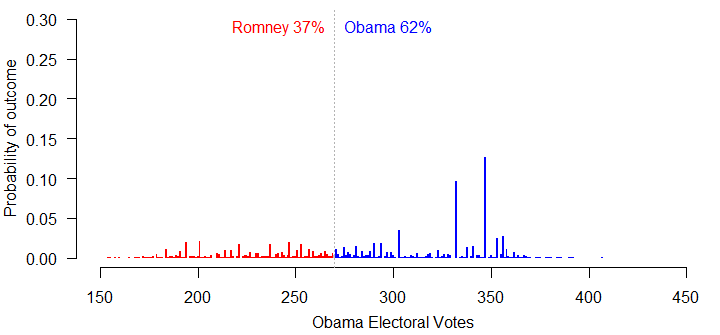
If the polls are all biased 2% in Obama’s favor, the simulation moves Romney up to a 37% chance of winning – still not great, but at least better than 8%.

No wonder the Republicans are starting to challenge the polls. Unfortunately, there’s no serious indication that the polls are behaving strangely this year.

The Polls Are Behaving Just Fine

With the pace of polling increasing, there are going to be days when some polls seem to be especially surprising – or even contradictory. For example, a recent Washington Post survey found Obama up 8 points in Virginia, even though other polls indicate a tighter race. It’s pretty safe to say that Obama is not actually winning Virginia by 8 points. But this doesn’t mean the Post poll is biased, or wrong, or should be ignored. I imagine the Post did the best job they could. The likeliest explanation for the finding is simply random sampling error.

Even in a perfectly executed survey, there’s going to be error due to random sampling. A survey only contacts a small group of respondents, and those people won’t always be representative of the broader population. The smaller the sample, the larger the sample-to-sample variability. To see just how large sampling error can be, suppose my model is correct that Obama is currently preferred by 52% of decided, major-party voters in Virginia. Then in different surveys of 750 respondents (which is about the average size of the state polls), it wouldn’t be unusual to see results ranging anywhere from 48% to 56%, because of sampling variation alone. In fact, here’s the expected distribution of all poll results under this scenario: most should be right around 52%, but many won’t.

If we added in other possible sources of survey error (question wording, interviewer effects, mode effects, sample selection, and so forth), the distribution would become even wider. So just imagine two polls on the same day showing Romney with either 52% or 60% of the two-party vote. Astounding, right? No, not really. It happened in Missouri last week.

What is actually astounding about the polls this year is how well they are behaving, compared to theoretical expectations. For a given sample size, the margin of error tells us how many polls should fall within a certain range of the true population value. I’ll assume my model is correctly estimating the current level of preference for Obama over Romney in each state during the campaign. Then I can subtract from each observed poll result the model estimate on that day. This is the survey error. It turns out that most polls have been exactly where they should be – within two or three points of the model estimates. And that’s without any correction in my model for “house effects,” or systematic biases in the results of particular polling organizations.

Plotting each poll’s error versus its sample size (excluding undecideds) produces the following graph. The dashed lines correspond to a theoretical 95% margin of error at each sample size, assuming that error arises only from random sampling.

If the model is fitting properly, and if there are no other sources of error in the polls, then 95% of polls should fall within the dashed lines. The observed proportion is 94%. Certainly some polls are especially misleading – the worst outlier, in the lower right corner, is the large 9/9 Gravis Marketing poll that had Romney ahead in Virginia (and was singly responsible for the brief downward blip in the Virginia forecast last week). But what is most important – and what helps us trust the pollsters as well as their polls – is that the overall distribution of survey errors is very close to what we would expect if pollsters were conducting their surveys in a careful and consistent way.

The Obama Turnaround

More than 30 state polls have been released since the end of the DNC, and they point to an unmistakable U-turn in the trend in support for Obama over Romney. It’s the most consistently pro-Obama swing that we’ve seen at the state level all campaign, and it has been large enough to wipe out most of Obama’s losses in the polls since early August. That Obama received any bounce at all from the DNC, after Romney got nothing from the RNC, also suggests that voter preferences may not be so fixed, after all.

But while the momentum has shifted in Obama’s favor, the bounce itself is still fairly small by historical standards. My model – based only on the state polls – suggests that the overall effect of the DNC has been about 0.5% in a typical state. The size of this swing is consistent with other trends in opinion observed so far this year. If nothing else, it has been enough to keep Obama in the lead in the closest battleground states. The question now is whether the trend has peaked, and how much of the bounce will persist through Election Day.

Curiously, the post-convention bump has appeared to be larger in the national polls than it has in the individual state polls. The national polling aggregate at TPM finds Obama up 2% from early September – corresponding to a nearly 4-point current lead. The trackers at RCP and Huffington Post indicate similar gains. Compared to past years, 2% is still not a big effect – but, if accurate, it would be much more than any other swing in voter preferences since Romney secured the Republican nomination. If there really has been a shift of 2% nationally, we should be seeing it in the state polls, too. Hopefully, with more polling data, we’ll be able to resolve this discrepancy soon.

How Predictive are the Polls?

While we wait to get a sense of Obama’s post-convention bounce, it’s worth taking a look at how predictive the trial-heat polls can be at this (or any) point of the campaign. I’ll use the state-level surveys from 2008 as a guide. Applying my model to these data, I can estimate the daily level of support for Obama vs. McCain in all 50 states, from May through November. We can then compare the candidates’ standing in the polls during the campaign to each state’s election outcome, and see how those differences varied over time.

To begin, here’s the trend in voter preferences in Florida in 2008. Polls are plotted as circles, for the percent supporting Obama (out of the total for Obama or McCain). The thick line is the model’s estimate of the underlying level of support for Obama. The horizontal line indicates the result of the election, in which Obama received 51.4% of the two-party vote.

The trend is similar to what happened in most states: Obama polled behind his eventual vote share throughout the summer, then lost more ground following the RNC and selection of Sarah Palin. But once the the financial crisis began, Obama quickly gained in the polls – and by early October, the polls were about (on average) where the election ended up.

Next, I calculate the difference between each state’s daily estimate of voter opinion and the state’s election result, and average these across all 50 states. This is the mean absolute deviation, or MAD.

On average, the state polls (fed through my model) were off by 2%-3% through August, increasing to a maximum average error of 4% after the RNC. But by Election Day, the poll-based estimates only differed from the actual outcomes by an average of 1.4%. In states that were most competitive – and therefore polled more frequently – the error was even lower. If we isolate the eight closest states, where Obama finished with between 46% and 54% of the two-party vote, the average error on Election Day was a minuscule (and fairly remarkable) 0.4%.

So, in 2008, the polls were highly accurate over the last month of the campaign; and somewhat less so prior to that.

But looking at the polls isn’t the only way to predict the election outcome. In August and September of 2008, political scientists published a series of forecasts of the national-level vote, based upon long-term structural factors such as levels of economic growth, unemployment rates, whether the incumbent is running for re-election, and so forth. How well did these forecasts perform? The median prediction was that Obama would win 52% of the two-party vote. If we assume uniform swing and home-state effects relative to 2004 (as I describe here), this would have translated to an average state-level error of 3.2% – greater than that of the poll-based estimates for almost the entire campaign.

In fact, the minimum state-level MAD that any national-level election forecast could have produced in 2008 was 2.6%. Here I’ve plotted the state MAD under various assumptions about the national vote outcome (again, using uniform swing with home-state effects). The reason for this lower bound is that although uniform swing is an extremely useful model, it isn’t perfect. From election to election, state vote outcomes still tend to vary by an additional 3%-5% or more beyond the national swing.

The forecasts that I’m showing on this site are produced by combining long-term factors with estimates of current opinion based on the state polls. This stabilizes the forecasts relative to the polls alone, while also reducing the forecast MAD, as can be seen in my paper (Figure 4). In 2008, state forecasts using my model maintained an average error below 2% for the final two months of the campaign.

RNC Verdict: No Bounce (yet)

The first batch of state polls are in, following last week’s Republican National Convention. Two surveys were completed 8/30 in North Carolina, and five more finished 9/2 in North Carolina, Michigan, Colorado, and Florida (2). It’s not a whole lot to go on, but so far, all indications are that voters have not swung towards Romney as a result of the RNC. If anything, Romney’s level of support appears to be continuing its slight downward trend from mid-August.

Is this surprising from a historical standpoint? Absolutely. A week of high-profile, positive convention exposure for the Romney campaign should have made at least a few percentage points of difference. Traditionally, it has. (And indeed, some analysts claim to be seeing a bounce; though others don’t.) But if there was truly no effect of the RNC on voter opinion – even in the short term – then it strongly suggests that either voters didn’t like what they were hearing, had already made up their minds, or simply weren’t paying much attention (all relatively speaking, of course). Considering Obama’s current lead in the polls, none of these scenarios are good for Romney. And if it turns out that Obama does receive a bounce coming out of the DNC, then we can likely conclude that the reason Romney didn’t get a bounce from the RNC isn’t because voter opinion is just fundamentally difficult to move this year.

As more polls are released this week, estimates of the state trends during both the RNC and DNC will continue to update. Each time a new survey is added to the dataset, the model re-calculates the entire set of trendlines for all 50 states. So we may see some corrections. On the other hand, the states where this latest group of polls were fielded had all been pretty well-polled leading up to the RNC. If Romney gained ground from the convention, it should be showing up somewhere, and right now it’s not.

« Older posts Newer posts »

© 2024 VOTAMATIC

Theme by Anders NorenUp ↑