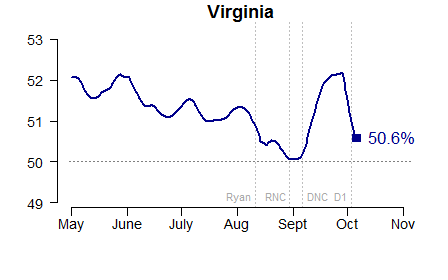
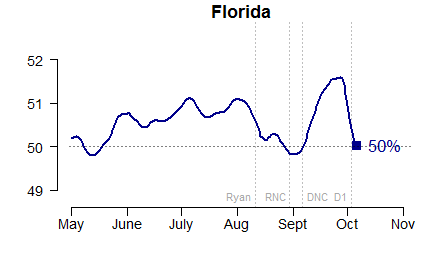
If you believe the polls, Obama is in good shape for reelection. And my model’s not the only one showing this: you’ll find similar assessments from a range of other poll-watchers, too. The lead is clear enough that The New Republic’s Nate Cohn recently wrote, “If the polls stay where they are, which is the likeliest scenario, Obama would be a heavy favorite on Election Day, with Romney’s odds reduced to the risk of systemic polling failure.”
What would “systemic” polling failure look like? In this case, it would mean that not only are some of the polls overstating Obama’s level of support; but that most – or even all – of the polls have been consistently biased in Obama’s favor. If this is happening, we’ll have no way to know until Election Day. (Of course, it’s just as likely that the polls are systematically underestimating Obama’s vote share, but then Democrats have even less to be worried about.)
A failure of this magnitude would be major news. It would also be a break with recent history. In 2000, 2004, and 2008, presidential polls conducted just before Election Day were highly accurate, according to studies by Michael Traugott here and here; Pickup and Johnston; and Costas Panagopoulos. My own model in 2008 produced state-level forecasts based on the polls that were accurate to within 1.4% on Election Day, and 0.4% in the most competitive states.
Could this year be different? Methodologically, survey response rates have fallen below 10%, but it’s not evident how this necessarily helps Obama. Surveys conducted using automatic dialers (rather than live interviewers) often have even lower response rates, and are prohibited from calling cell phones – but, again, this tends to produce a pro-Republican – not pro-Democratic – lean. And although there are certainly house effects in the results of different polling firms, it seems unlikely that Democratic-leaning pollsters would intentionally distort their results to such an extent that they discredit themselves as reputable survey organizations.
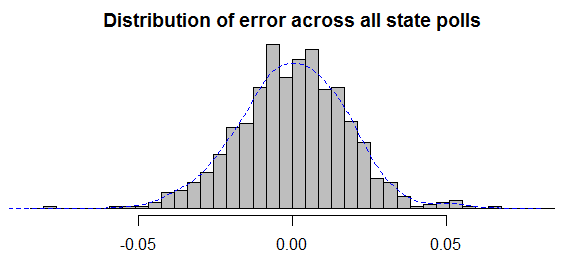
My analysis has shown that despite these potential concerns, the state polls appear to be behaving almost exactly as we should expect. Using my model as a baseline, 54% of presidential poll outcomes are within the theoretical 50% margin of error; 93% are within the 90% margin of error, and 96% are within the 95% margin of error. This is consistent with a pattern of random sampling plus minor house effects.
Nevertheless, criticisms of the polls – and those of us who are tracking them – persist. One of the more creative claims about why the polling aggregators might be wrong this year comes from Sean Trende of RealClearPolitics and Jay Cost of The Weekly Standard. Their argument is that the distribution of survey errors has been bimodal – different from the normal distribution of errors produced by simple random sampling. If true, this would suggest that pollsters are envisioning two distinct models of the electorate: one more Republican, the other more Democratic. Presuming one of these models is correct, averaging all the polls together – as I do, and as does the Huffington Post and FiveThirtyEight – would simply contaminate the “good” polls with error from the “bad” ones. Both Trende and Cost contend the “bad” polls are those that favor Obama.
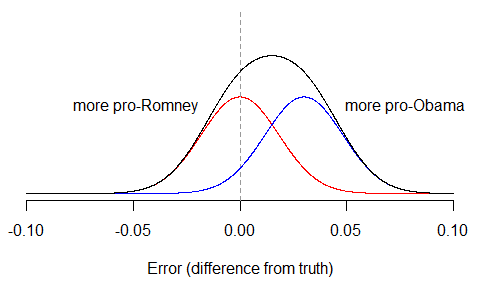
The problem with this hypothesis is that even if it was true (and the error rates suggest it’s not), there would be no way to observe evidence of bimodality in the polls unless the bias was way larger than anybody is currently claiming. The reason is because most of the error in the polls will still be due to random sampling variation, which no pollster can avoid. To see this, suppose that half the polls were biased 3% in Obama’s favor – a lot! – while half were unbiased. Then we’d have two separate distributions of polls: the unbiased group (red), and the biased group (blue), which we then combine to get the overall distribution (black). The final distribution is pulled to the right, but it still only has one peak.
Of course, it’s possible that in any particular state, with small numbers of polls, a histogram of observed survey results might just happen to look bimodal. But this would have to be due to chance alone. To conclude from it that pollsters are systematically cooking the books, only proves that apophenia – the experience of seeing meaningful patterns or connections in random or meaningless data – is alive and well this campaign season.
The election is in a week. We’ll all have a chance to assess the accuracy of the polls then.
Update: I got a request to show the actual error distributions in the most frequently-polled states. All errors are calculated as a survey’s reported Obama share of the major-party vote, minus my model’s estimate of the “true” value on the day and state of that survey. Positive errors indicate polls that were more pro-Obama, negative errors are for polls that were more pro-Romney. To help guide the eye, I’ve overlaid kernel density plots (histogram smoothers) in blue. The number of polls per state are in parentheses.
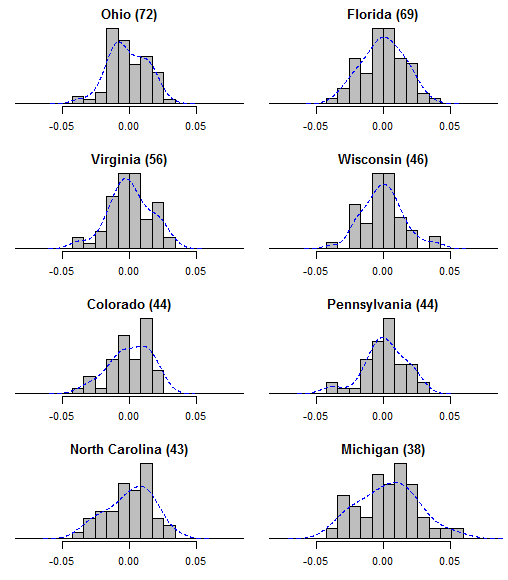
It may also help to see the overall distribution of errors across the entire set of state polls. After all, if there is “bimodality” then why should it only show up in particular states? The distribution looks fine to me.
