Cross-posted at Daily Kos Elections
Even before news broke this weekend about Donald Trump’s 2005 Access Hollywood tapes, he had been receiving some extremely bleak polling numbers. As of today, Trump trails Hillary Clinton by 9 points in Virginia, by 8 points in Pennsylvania, by 6 points in Colorado, by 4 points in Florida, and by 3 points in North Carolina.
When we run all of these polls though our presidential forecasting model, it predicts that Trump has less than a 10 percent chance of winning the presidency.
Those are long odds. But they follow from the data. Here’s why our model is able to make such a strong prediction—and why we’re not the only forecasters to see the race this way.
Our model starts by forecasting the outcome of the presidential election in all 50 states and Washington, D.C., and then aggregates those results up to a national forecast. As expected, the polls show that there are a range of states that are “safe” for either Clinton or Trump—that is, where one candidate has at least a 99 percent chance of winning. But given our uncertainty about what could happen between now and Election Day, there also are states like Nevada, Ohio, and Iowa that could go either way. The full set of probabilities that Clinton or Trump will win each state are in the left sidebar on our presidential election overview page.
The next step is to convert all of these state probabilities into an overall chance that Clinton or Trump will win the election. For the sake of illustration, the simplest way to do this is to randomly simulate each state’s election outcome a large number of times and record the winner. From our current estimates, Clinton would win Nevada in 63 percent of simulations, Ohio in 46 percent of simulations, and so on. Again for ease, assume that the state outcomes are independent, so that whether Clinton wins Nevada has no bearing on whether she also wins Ohio. This isn’t completely realistic—and in fact, it’s not how our model works—but it’s a sufficient approximation. In each simulation, the candidate who wins each state receives all of that state’s electoral votes, which we add across all 50 states and D.C.
If we follow this procedure with our current set of state probabilities, Clinton comes out ahead in 99 percent of simulations. That is, in only 1 out of every 100 simulated elections does Donald Trump receive 270 or more electoral votes, and win the election. Clinton’s lead is so substantial that if we count up the electoral votes in the states she’s most likely to win, she gets to 273 by winning Colorado—an outcome that our model estimates is 94 percent likely.
On the other hand, finding a permutation of states that is consistent with the polling data and that gets Trump to 270 electoral votes is extremely difficult. In his most favorable scenario, Trump would have to win Colorado, where he only has a 6 percent chance, and Florida, where has has a 20 percent chance, and North Carolina, where he has a 35 percent chance, and Nevada, where he has a 37 percent chance, and every other state where his level of support is higher. If Trump loses any single one of these states, Clinton wins the election.
The other major forecasting models aren’t any more favorable to Trump’s chances. If we take the probabilities of winning each state currently being forecasted by The Upshot, FiveThirtyEight, The Huffington Post, PredictWise, and the Princeton Election Consortium, and run them through the same simulation, the result is nearly identical: Clinton’s implied chances of winning the national election are close to 100 percent:
- FiveThirtyEight: 98 percent
- The Upshot: 97 percent
- The Huffington Post: 99 percent
- Princeton Election Consortium: 98 percent
- PredictWise: 99 percent
The distributions of simulated electoral votes for Hillary Clinton under each model—again, by simply taking the state forecasts at face value—reinforce the challenge Trump faces. In every one of the models’ electoral vote histograms, there are almost no outcomes to the left of the blue line at 269 electoral votes, which is what Trump would need to win.
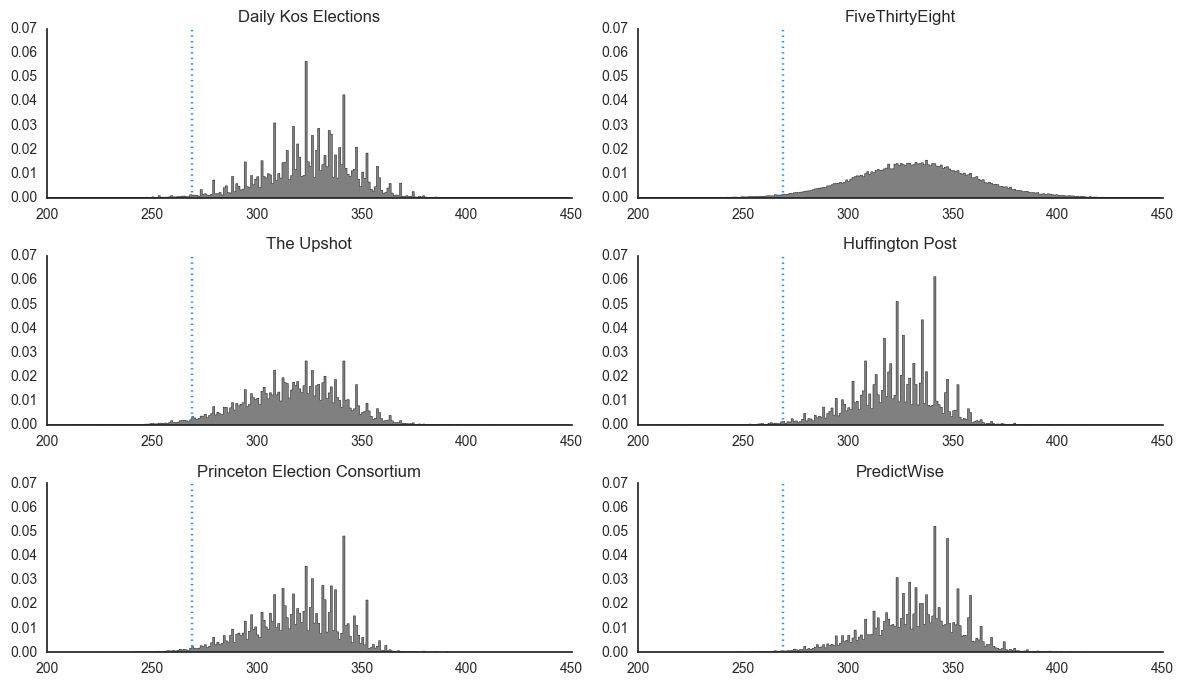
These histograms—and the chances of Clinton winning—are different from what each model is actually reporting as their national-level forecast because, like us, none of the other forecasters assume that state election outcomes are independent. If the polls are wrong, or if there’s a national swing in voter preferences toward Trump, then his odds should increase in many states at once: Nevada, Ohio, Florida, and so forth.
This adds extra uncertainty to the forecast, which widens the plausible range of electoral vote outcomes, and lowers Clinton’s chances of winning. The additional assumptions of The Upshot model, for example, bring Clinton’s overall chances down to 87 percent. In the FiveThirtyEight model, Clinton’s chances drop to 84 percent; and their histogram in particular looks very different than what I plotted above. (The Upshot recently published a pair of articles that explored these modeling choices more thoroughly.)
What this demonstrates, though, is that at this point in the campaign, the disagreements between the presidential models’ forecasts are primarily due to differences in the way uncertainty is carried through from the state forecasts to the national forecast. It is not that any of the forecasting models have a fundamentally more pro-Trump interpretation of the data. The models are essentially in agreement. Donald Trump is extremely unlikely to win the presidential election.

Am I right in thinking that PEC does assume no correlation between states for their snapshot (not just gathered from the above, but reading their methodology here http://election.princeton.edu/faq/). That is, no assumption of error correlation?
However, when they project a path into the future, they then do assume some correlation in the movement. So, there is an assumption of future direction correlation but, it appears, less than others
Been waiting for your poll numbers. Let’s hope they stay true.
(FIRST!)
Hank.
Forget the Polls Trump WON BIG and he will WIN BIG again in 2020