• Another Look at Survey Bias

    by  • November 2, 2012 • 102 Comments

    Questions continue to be raised about the accuracy of the polls. Obviously, in just a few more days, we’ll know which polls were right (on average) and which were wrong. But in the meantime, it’s useful to understand how the polls are – at the very least – different from one another, and form a baseline set of expectations to which we can compare the election results on Tuesday. The reason this question takes on special urgency now is that there’s essentially no time left in the campaign for preferences to change any further: if the state polls are right, then Obama is almost certain to be reelected.

    In previous posts, I’ve looked at both house effects, and error distributions (twice!), but I want to return to this one more time, because it gets to the heart of the debate between right-leaning and left-leaning commentators over the trustworthiness of the polls.

    A relatively small number of survey firms have conducted a majority of the state polls, and therefore have a larger influence on the trends and forecasts generated by my model. Nobody disputes that there have been evident, systematic differences in the results of these major firms: some leaning more pro-Romney, others leaning more pro-Obama. As I said at the outset, we’ll know on Election Day who’s right and wrong.

    But here’s a simple test. There have been hundreds of smaller organizations who have released fewer than a half-dozen polls each. Most have only released a single poll. We can’t reliably estimate the house effects for all of these firms individually. However, we can probably safely assume that in aggregate they aren’t all ideologically in sync – so that whatever biases they have will all cancel out when pooled together. We can then compare the overall error distribution of the smaller firms’ surveys to the error distributions of the larger firms’ surveys. (The survey error is simply the difference between the proportion supporting Obama in a poll, and my model’s estimate of the “true” proportion on that state and day.)

    If the smaller firms’ errors are distributed around zero, then the left-leaning firms are probably actually left-leaning, and the right-leaning firms are probably actually right-leaning, and this means that they’ll safely cancel each other out in my results, too. On the other hand, if the smaller firms’ error distribution matches either the left-leaning or the right-leaning firms’ error distribution, then it’s more likely the case that those firms aren’t significantly biased after all, and it’s the other side’s polls that are missing the mark.

    What do we find? This set of kernel density plots (smoothed histograms) shows the distribution of survey errors among the seven largest survey organizations, and in grey, the distribution of errors among the set of smaller firms. The smaller firms’ error distribution matches that of Quinnipiac, SurveyUSA, YouGov, and PPP. The right-leaning firms – Rasmussen, Gravis Marketing, and ARG – are clearly set apart on the pro-Romney side of the plot.

    If, on Election Day, the presidential polls by Quinnipiac, SurveyUSA, YouGov, and PPP prove to be accurate, then the polls by Rasmussen, Gravis Marketing, and ARG will all have been underestimating Obama’s level of support by 1.5% consistently, throughout the campaign. Right now, assuming zero overall bias, Florida is 50-50. The share of Florida polls conducted by Rasmussen, Gravis Marketing, and ARG? 20%. Remove those polls from the dataset, and Obama’s standing improves.

    Four days to go.

    Can We Trust the Polls?

    by  • October 28, 2012 • 107 Comments

    If you believe the polls, Obama is in good shape for reelection. And my model’s not the only one showing this: you’ll find similar assessments from a range of other poll-watchers, too. The lead is clear enough that The New Republic’s Nate Cohn recently wrote, “If the polls stay where they are, which is the likeliest scenario, Obama would be a heavy favorite on Election Day, with Romney’s odds reduced to the risk of systemic polling failure.”

    What would “systemic” polling failure look like? In this case, it would mean that not only are some of the polls overstating Obama’s level of support; but that most – or even all – of the polls have been consistently biased in Obama’s favor. If this is happening, we’ll have no way to know until Election Day. (Of course, it’s just as likely that the polls are systematically underestimating Obama’s vote share, but then Democrats have even less to be worried about.)

    A failure of this magnitude would be major news. It would also be a break with recent history. In 2000, 2004, and 2008, presidential polls conducted just before Election Day were highly accurate, according to studies by Michael Traugott here and here; Pickup and Johnston; and Costas Panagopoulos. My own model in 2008 produced state-level forecasts based on the polls that were accurate to within 1.4% on Election Day, and 0.4% in the most competitive states.

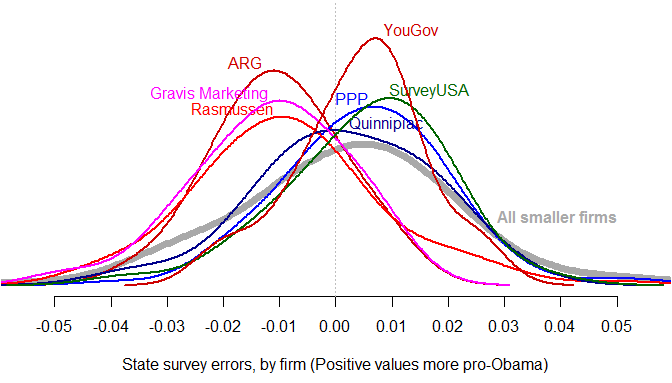
    Could this year be different? Methodologically, survey response rates have fallen below 10%, but it’s not evident how this necessarily helps Obama. Surveys conducted using automatic dialers (rather than live interviewers) often have even lower response rates, and are prohibited from calling cell phones – but, again, this tends to produce a pro-Republican – not pro-Democratic – lean. And although there are certainly house effects in the results of different polling firms, it seems unlikely that Democratic-leaning pollsters would intentionally distort their results to such an extent that they discredit themselves as reputable survey organizations.

    My analysis has shown that despite these potential concerns, the state polls appear to be behaving almost exactly as we should expect. Using my model as a baseline, 54% of presidential poll outcomes are within the theoretical 50% margin of error; 93% are within the 90% margin of error, and 96% are within the 95% margin of error. This is consistent with a pattern of random sampling plus minor house effects.

    Nevertheless, criticisms of the polls – and those of us who are tracking them – persist. One of the more creative claims about why the polling aggregators might be wrong this year comes from Sean Trende of RealClearPolitics and Jay Cost of The Weekly Standard. Their argument is that the distribution of survey errors has been bimodal – different from the normal distribution of errors produced by simple random sampling. If true, this would suggest that pollsters are envisioning two distinct models of the electorate: one more Republican, the other more Democratic. Presuming one of these models is correct, averaging all the polls together – as I do, and as does the Huffington Post and FiveThirtyEight – would simply contaminate the “good” polls with error from the “bad” ones. Both Trende and Cost contend the “bad” polls are those that favor Obama.

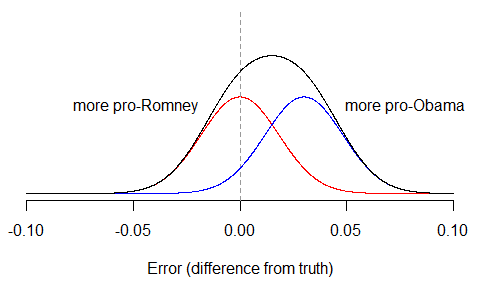
    The problem with this hypothesis is that even if it was true (and the error rates suggest it’s not), there would be no way to observe evidence of bimodality in the polls unless the bias was way larger than anybody is currently claiming. The reason is because most of the error in the polls will still be due to random sampling variation, which no pollster can avoid. To see this, suppose that half the polls were biased 3% in Obama’s favor – a lot! – while half were unbiased. Then we’d have two separate distributions of polls: the unbiased group (red), and the biased group (blue), which we then combine to get the overall distribution (black). The final distribution is pulled to the right, but it still only has one peak.

    Of course, it’s possible that in any particular state, with small numbers of polls, a histogram of observed survey results might just happen to look bimodal. But this would have to be due to chance alone. To conclude from it that pollsters are systematically cooking the books, only proves that apopheniathe experience of seeing meaningful patterns or connections in random or meaningless data – is alive and well this campaign season.

    The election is in a week. We’ll all have a chance to assess the accuracy of the polls then.

    Update: I got a request to show the actual error distributions in the most frequently-polled states. All errors are calculated as a survey’s reported Obama share of the major-party vote, minus my model’s estimate of the “true” value on the day and state of that survey. Positive errors indicate polls that were more pro-Obama, negative errors are for polls that were more pro-Romney. To help guide the eye, I’ve overlaid kernel density plots (histogram smoothers) in blue. The number of polls per state are in parentheses.

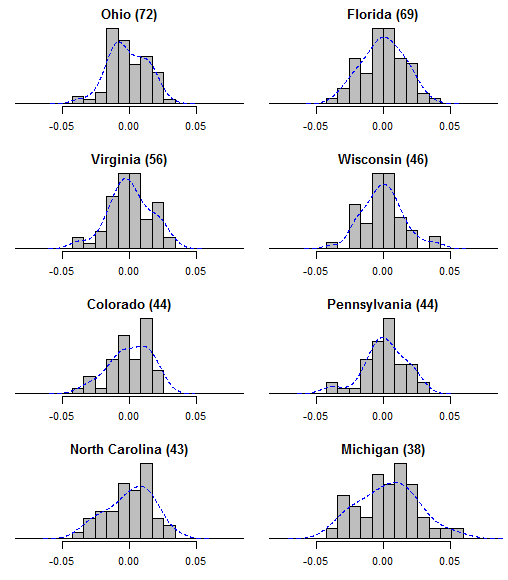
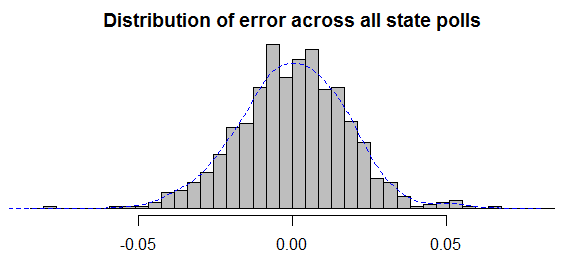
    It may also help to see the overall distribution of errors across the entire set of state polls. After all, if there is “bimodality” then why should it only show up in particular states? The distribution looks fine to me.

    Site Updates, Every Day or Two

    by  • October 26, 2012 • 73 Comments

    I’ll be updating my forecasts and trendlines from the latest polls every day or two between now and the election. I know everyone is anxious about the outcome. But there’s a limit to how much we can learn about the race on a daily basis. The high-quality polls take a few days to complete, and the data are so noisy that we need a large number of them before a trend can be confirmed, anyway.

    The comments on the last post got a bit long – you’re welcome to pick up the conversation here, and I’ll try to respond where I can.

    Edit: The site has started getting a lot of traffic, and sometimes isn’t loading properly. Apologies; I’ll see if there’s anything I can do about it.

    Into the Home Stretch

    by  • October 22, 2012 • 89 Comments

    With the debates complete, and just two weeks left in the campaign, there’s enough state-level polling to know pretty clearly where the candidates currently stand. If the polls are right, Obama is solidly ahead in 18 states (and DC), totaling 237 electoral votes. Romney is ahead in 23 states, worth 191 electoral votes. Among the remaining battleground states, Romney leads in North Carolina (15 EV); Obama leads in Iowa, Nevada, New Hampshire, Ohio, and Wisconsin (44 EV); and Florida, Virginia, and Colorado (51 EV) are essentially tied. Even if Romney takes all of these tossups, Obama would still win the election, 281-257.

    The reality in the states – regardless of how close the national polls may make the election seem – is that Obama is in the lead. At the Huffington Post, Simon Jackman notes “Obama’s Electoral College count lies almost entirely to the right of 270.” Sam Wang of the Princeton Election Consortium recently put the election odds “at about nine to one for Obama.” The DeSart and Holbrook election forecast, which also looks at the current polls, places Obama’s re-election probability at over 85%. Romney would need to move opinion by another 1%-2% to win – but voter preferences have been very stable for the past two weeks. And if 1%-2% doesn’t seem like much, consider that Romney’s huge surge following the first debate was 2%, at most.

    From this perspective, it’s a bit odd to see commentary out there suggesting that Romney should be favored, or that quantitative, poll-based analyses showing Obama ahead are somehow flawed, or biased, or not to be believed. It’s especially amusing to see the target of this criticism be the New York Times’ Nate Silver, whose FiveThirtyEight blog has been, if anything, unusually generous to Romney’s chances all along. Right now, his model gives Romney as much as a 30% probability of winning, even if the election were held today. Nevertheless, The Daily Caller, Commentary Magazine, and especially the National Review Online have all run articles lately accusing Silver of being in the tank for the president. Of all the possible objections to Silver’s modeling approach, this certainly isn’t one that comes to my mind. I can only hope those guys don’t stumble across my little corner of the Internet.

    Model Checking

    by  • October 10, 2012 • 5 Comments

    One of the fun things about election forecasting from a scientific standpoint is that on November 6, the right answer will be revealed, and we can compare the predictions of our models to the actual result. It’s not realistic to expect any model to get exactly the right answer – the world is just too noisy, and the data are too sparse and (sadly) too low quality. But we can still assess whether the errors in the model estimates were small enough to warrant confidence in that model, and make its application useful and worthwhile.

    With that said, here are the criteria I’m going to be using to evaluate the performance of my model on Election Day.

    1. Do the estimates of state opinion trends make sense? Although we won’t ever know exactly what people were thinking during the campaign, the state trendlines should at least pass through the center of the data. This validation also includes checking that the residual variance in the polls matches theoretical expectations, which so far, it has.
    2. How large is the average difference between the state vote forecasts and the actual outcomes? And did this error decline in a gradual manner over the course of the campaign? In 2008, the average error fell from about 3% in July to 1.4% on Election Day. Anything in this neighborhood would be acceptable.
    3. What proportion of state winners were correctly predicted? Since what ultimately matters is which candidate receives a plurality in each state, we’d like this to be correct, even if the vote share forecast is a bit off. Obviously, states right at the margin (for example, North Carolina, Florida, and Colorado) are going to be harder to get right.
    4. Related to this, were the competitive states identified early and accurately? One of the aims of the model is to help us distinguish safe from swing states, to alert us where we should be directing most of our attention.
    5. Do 90% of state vote outcomes fall within the 90% posterior credible intervals of the state forecasts? This gets at the uncertainty in the model estimates. I use a 90% interval so that there’s room to detect underconfidence as well as overconfidence in the forecasts. In 2008, the model was a bit overconfident. For this year, I’ll be fine with 80% coverage; if it’s much lower than that, I’ll want to revisit some of the model assumptions.
    6. How accurate was the overall electoral vote forecast? And how quickly (if at all) did it narrow in on the actual result? Even if the state-level estimates are good, there might be an error in how the model aggregates those forecasts nationally.
    7. Was there an appropriate amount of uncertainty in the electoral vote forecasts? Since there is only one electoral vote outcome, this will involve calculating the percentage of the campaign during which the final electoral vote was within the model’s 95% posterior credible interval. Accepting the possibility of overconfidence in the state forecasts, this should not fall below 85%-90%.
    8. Finally, how sensitive were the forecasts to the choice of structural prior? Especially if the model is judged to have performed poorly, could a different prior specification have made the difference?

    If you can think of any I’ve left off, please feel free to add them in the comments.